programming Monitoring & Observability — 122 tools curated by the community. Most popular: StatusScout, Wachd, OpenLIT. Each tool comes with a review, tags and alternatives to help you choose.
❓ Frequently asked questions about Monitoring & Observability
What is Monitoring & Observability?
Monitoring & Observability groups 122 tools curated by the mySelectas community. Most popular: StatusScout.
What are the best free Monitoring & Observability tools?
mySelectas lists several free options in this category. See in particular: StatusScout, Wachd, OpenLIT.
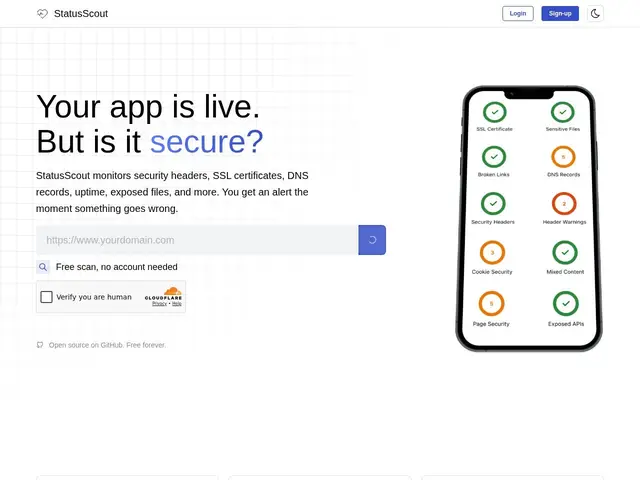
The short version: StatusScout bundles several checks (uptime, SSL, security headers, exposed secrets, subdomain takeover risk) that most people otherwise juggle across three or four separate tools, and the combination of a genuinely free self-hosted tier plus a no-signup free scan makes it very low-friction to try.
Compared to point solutions — a dedicated uptime monitor like UptimeRobot, a separate SSL checker, and a separate header-scanning tool — StatusScout's value is consolidation: one dashboard, one alerting setup, covering security posture and availability together. Self-hosting is fr…
👥 Target audience
Developers, freelancers, and agencies monitoring uptime and security posture for client sites
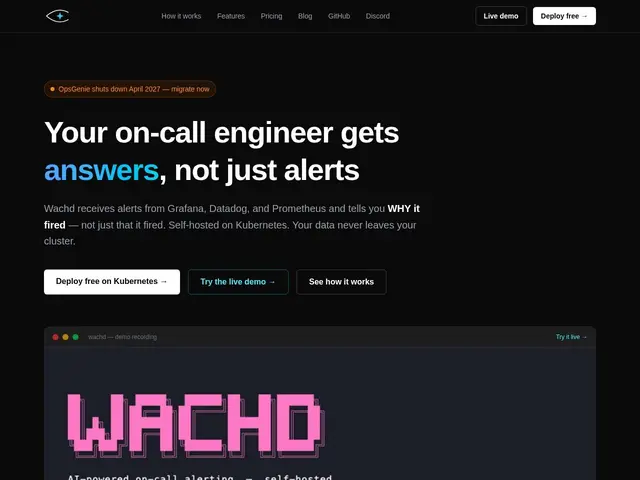
The short version: Wachd targets a genuinely underserved niche — AI root-cause analysis you can run fully air-gapped — and that's the reason to pick it over a bigger name like OpsGenie or Datadog's own AI features.
At 36 GitHub stars it's an early-stage project without OpsGenie's decade of on-call scheduling maturity or Datadog's all-in-one observability suite, so teams already happy with their alerting tool's routing and escalation features won't gain much by switching just for on-call scheduling. Where Wachd earns its place is the compliance angle: if your organization can't send logs or co…
👥 Target audience
DevOps/SRE teams, especially in regulated/data-residency-constrained environments
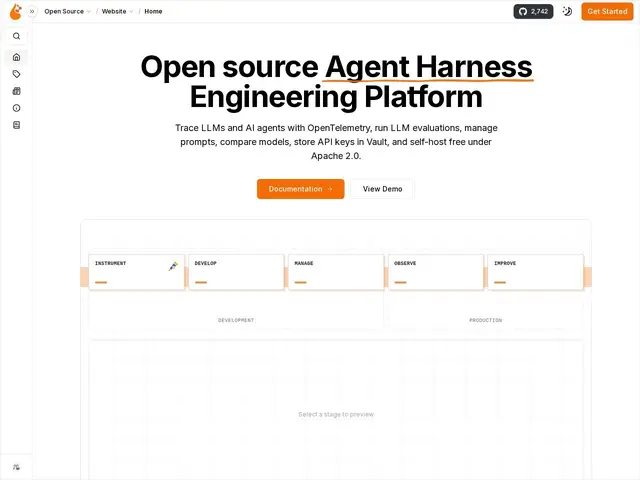
The short version: OpenLIT is a solid, free, self-hosted way to get LLM observability without paying a SaaS vendor per trace — but it enters an already-crowded space, so pick it for its OpenTelemetry-native architecture specifically, not just because it's free.
At roughly 2.7k GitHub stars it's smaller and younger than Helicone or Langfuse, both of which also offer free self-hosted tiers and larger communities — the real differentiator is that OpenLIT builds on standard OpenTelemetry traces rather than a proprietary SDK, which matters if you already run an OTel pipeline (Grafana, Datadog, etc…
👥 Target audience
Developers and engineers building AI applications needing production observability
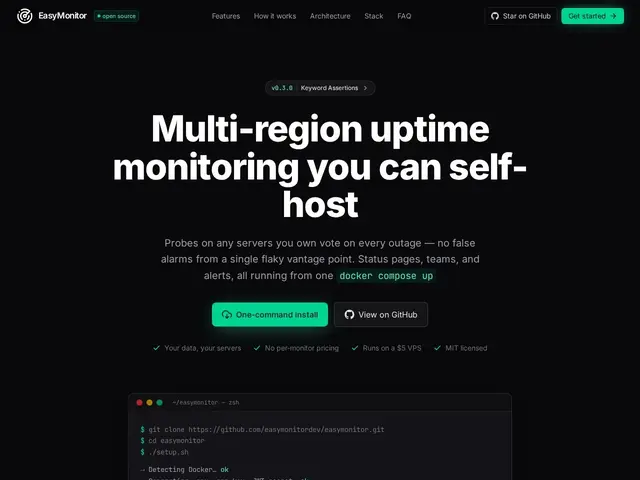
The short version: EasyMonitor's actual selling point is reducing false-positive alerts through multi-region quorum voting — worth choosing specifically for that reason, not just because it's "another free Uptime Kuma alternative."
This is a genuinely crowded niche: Uptime Kuma, OpenStatus, Checkmate and Upptime are all free, open-source, self-hosted options already well established, some with thousands of GitHub stars and years of community testing. EasyMonitor's differentiator — several probes voting on whether an outage is real — directly targets a real, common pain point (a monitor flaggi…
👥 Target audience
Teams wanting self-hosted uptime monitoring with fewer false alarms
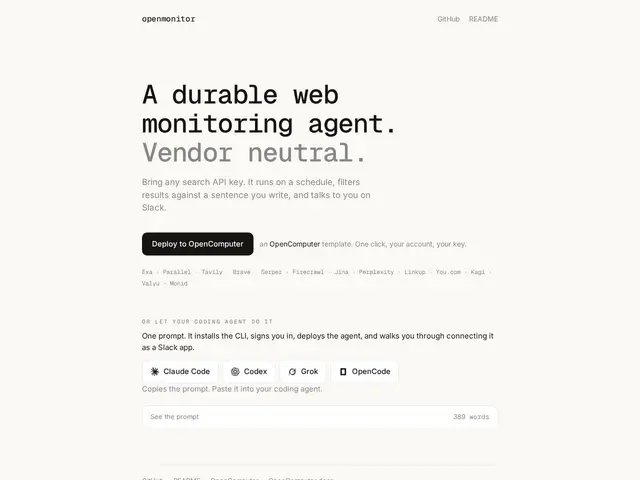
The short version: OpenMonitor's real differentiator against single-vendor tools like Exa Monitors or Parallel Monitor is that it doesn't marry you to one search engine — you can swap providers per job without rebuilding the monitor, which matters because search quality genuinely varies a lot by use case (Kagi and Perplexity are strong for different things than Brave or Firecrawl).
Being open source and backed by Digger, an established name in infrastructure tooling, is a real trust signal for something you're going to depend on running unattended in the background — you can self-host or audi…
👥 Target audience
Développeurs et équipes techniques voulant surveiller le web en continu sans dépendre d'un seul moteur de recherche
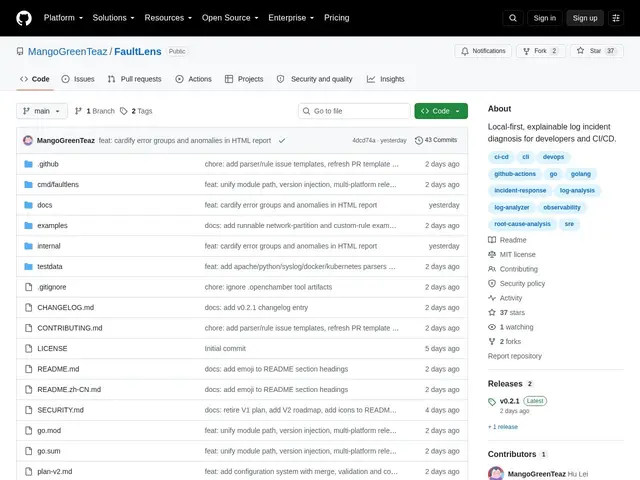
The short version: FaultLens is what you'd build if you wanted "grep -i error" to actually explain itself, using statistics you can audit rather than an LLM you have to trust.
Compared to sending logs to a cloud APM like Datadog or New Relic, FaultLens never leaves your machine and needs no subscription, which matters for cost-sensitive teams or logs that can't leave your infrastructure — the trade-off is it's CLI-only, single-machine, and won't aggregate logs across a fleet like a real observability platform does. It's free and open-source (MIT); worth adding to a CI pipeline or an on-call r…
👥 Target audience
Développeurs et équipes CI/CD voulant diagnostiquer des incidents localement sans envoyer leurs logs dans le cloud
The short version: Lantern is the self-hosted alternative to "just use a SaaS uptime monitor" for people who'd rather own their status data and don't mind running one extra Go binary.
Against Uptime Kuma, the most common self-hosted comparison, Lantern's Docker auto-discovery and single-binary/SQLite deployment make setup a bit lighter, and its flap dampening plus quiet hours are aimed squarely at cutting 3am false alarms. Against Datadog or New Relic, it obviously doesn't do APM or tracing — it's a focused uptime/status tool, not a full observability suite. Free and MIT-licensed, it's a soli…
👥 Target audience
Équipes DevOps et self-hosters gérant quelques serveurs/containers qui veulent un tableau de bord de disponibilité
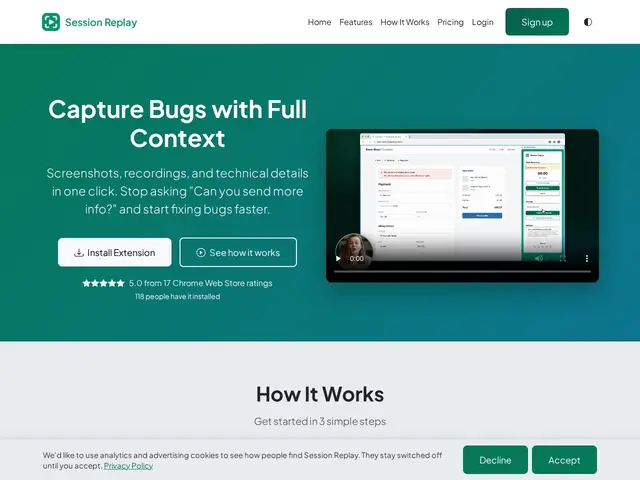
The short version: if your team keeps getting bug reports that say "it's broken" with zero technical detail, Session Replay's free-for-reporters model means you can roll it out to non-technical teammates or external testers at no cost, while you pay only for the owner-side dashboard.
Marker.io, BugHerd, and Jam.dev cover similar ground — visual bug reporting with technical context attached — and the $5 14-day trial is a low-risk way to compare Session Replay's automatic console/network capture against whichever of those you might already be considering. The real constraint is Chrome-only supp…
👥 Target audience
Équipes QA, développeurs et support technique qui reçoivent des rapports de bugs imprécis de la part de non-techniciens
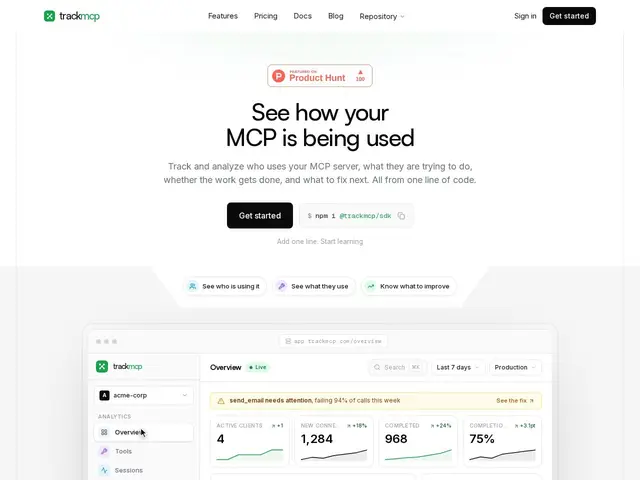
The short version: if you've shipped an MCP server and have no idea whether anyone's actually using it correctly, TrackMCP's one-line wrap is a fast way to find out — the plain-English weekly report is the actual selling point over raw dashboards.
The MCP observability space is brand new, so there isn't an established competitor with years of track record; the nearest comparisons are general APM tools like Datadog (overkill for a single MCP server) or newer MCP-specific tools like MCPcat. TrackMCP's edge is that it's purpose-built for MCP's specific failure modes (schema mismatches, silent to…
👥 Target audience
Développeurs et mainteneurs de serveurs MCP voulant des analyses d'usage et de fiabilité
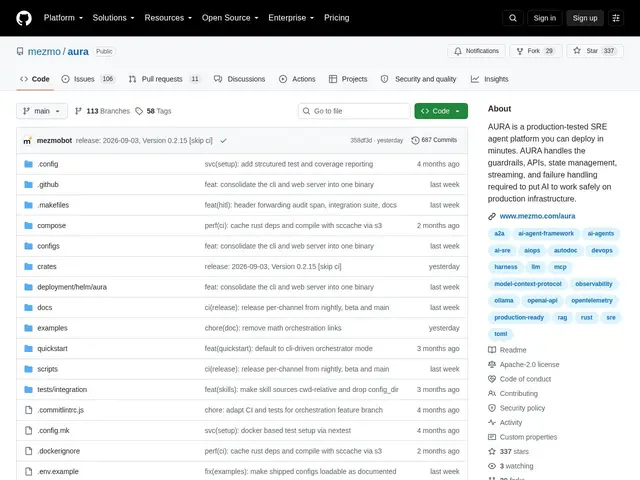
The short version: AURA is a serious, safety-first answer to "let AI agents help during incidents" — its guardrails and state management are the actual product, not an afterthought, which matters a lot when the agents in question can touch production.
Developed by Mezmo (the observability company behind the LogDNA product already listed in this catalog), AURA is explicitly a separate, independently self-hostable open-source project rather than a bundled feature of Mezmo's core SaaS — you can run it without being a Mezmo customer. Against building your own incident-response agent from scratch,…
👥 Target audience
Équipes SRE et ops voulant expérimenter la réponse aux incidents assistée par IA avec des garde-fous
🌍 Target countries
Worldwide
🗣️ Available languages
EN
🔄 Alternatives
Construire son propre agent d'incident sur mesureRunbooks d'automatisation classiques sans IA
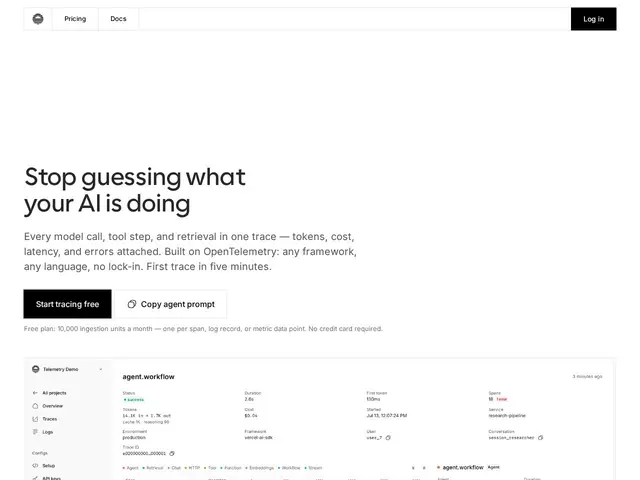
The short version: Telemetry.dev is solving the same problem as Langfuse and Helicone — LLM-specific observability — with OpenTelemetry as its foundation rather than a proprietary format, which matters if you want to avoid vendor lock-in on your traces.
Against Langfuse (open-source-first, strong prompt-management features) or Helicone (simpler proxy-based logging), Telemetry.dev's edge is standards compliance: OTLP support means your traces aren't stuck in a proprietary schema, and the 8,600+ model cost catalog with reasoning-token separation is more granular than most competitors offer out …
👥 Target audience
Équipes construisant des applications LLM/agents ayant besoin de tracer coûts et performance des appels modèles
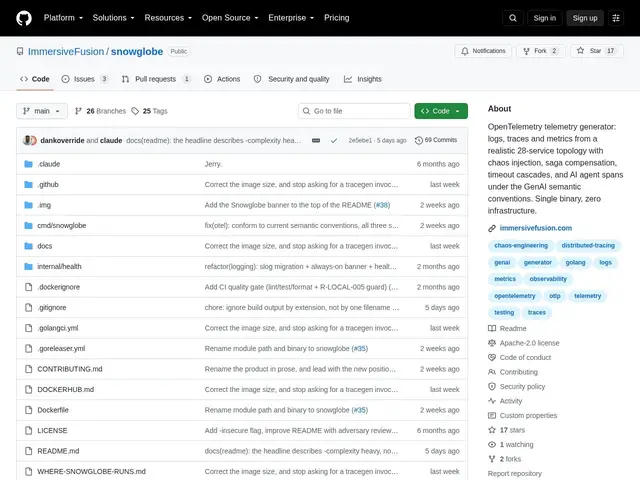
The short version: Snowglobe solves a specific, unglamorous problem well — you need realistic telemetry to validate an observability setup, and standing up real services just to generate test data is wasteful busywork.
There's no well-known direct competitor doing exactly this; most teams either hand-roll synthetic traffic scripts or repurpose the official OpenTelemetry Demo app (a real, deployed e-commerce demo, not a lightweight generator), which is heavier to run and less focused on injecting realistic failure modes. Snowglobe's single 6.4MB binary with tunable throughput and built-in chao…
👥 Target audience
Équipes développant ou évaluant des outils d'observabilité/APM ayant besoin de données de télémétrie réalistes sans vraie infra
🌍 Target countries
Worldwide
🗣️ Available languages
EN
🔄 Alternatives
OpenTelemetry Demo (app e-commerce officielle, plus lourde)Scripts de trafic synthétique maison
The short version: agents-workbook fills a narrow but real gap — auditing an AI coding agent's reasoning in real time, locally, without piping everything into a hosted observability platform.
Hosted LLM observability tools like LangSmith or Helicone capture traces at the API level and are built for production monitoring across many users and sessions; agents-workbook is scoped much narrower, to a single developer watching Claude Code or Codex work on their own machine, with the dashboard staying entirely local. That's a meaningful trade-off: you get simplicity and privacy instead of team dash…
👥 Target audience
Ingénieurs IA et développeurs utilisant Claude Code ou Codex qui veulent auditer le raisonnement de l'agent en temps réel.
🌍 Target countries
Marché anglophone, développeurs internationaux
🗣️ Available languages
EN
🔄 Alternatives
LangSmithHeliconeMode verbeux natif du terminal (sans dashboard)
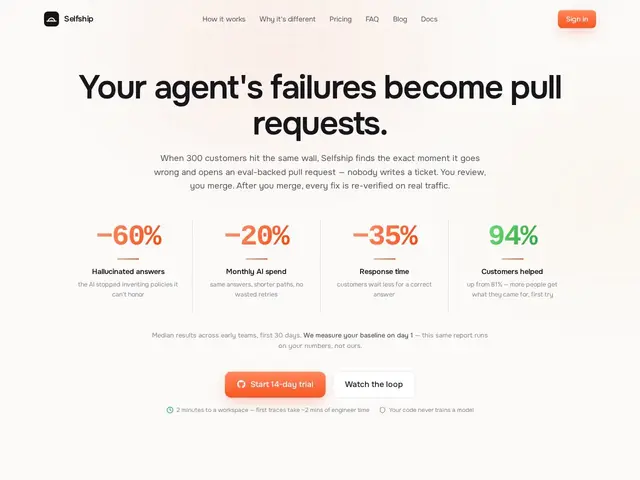
The short version: Selfship.ai's real pitch isn't detection (plenty of observability tools do that) — it's that it tries to close the loop by shipping the fix itself, then verifying the fix worked.
Generic LLM observability tools like LangSmith or Langfuse will show you traces and let you spot problems, and general error trackers like Sentry will catch crashes, but neither one groups failures by user intent or attempts an automated fix as a PR — that's Selfship's distinct claim. It's also a brand-new product (a single low-traffic Show HN launch at review time, no independently verified case s…
👥 Target audience
Équipes produit exploitant une application agentique (chatbot, assistant IA) en production et cherchant à détecter et corriger automatiquement les défaillances.
🌍 Target countries
Marché anglophone, startups et équipes IA internationales
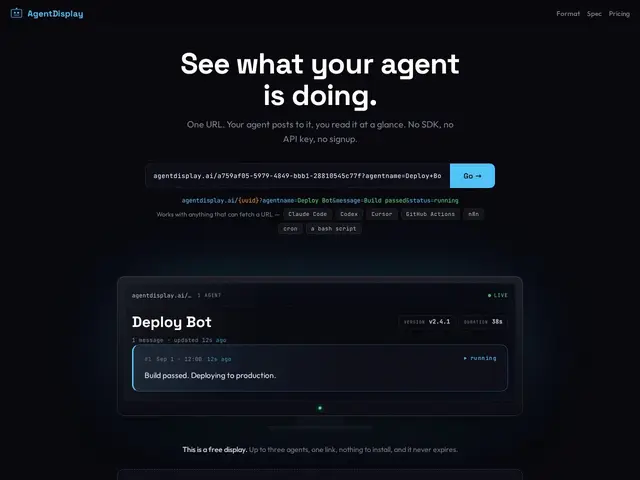
The short version: AgentDisplay deliberately trades depth for speed — you get a live status view in the time it takes to curl a URL, at the cost of the deep tracing and analytics a real observability platform like LangSmith provides.
Full LLM observability tools capture every trace, token, and reasoning step for later analysis; AgentDisplay isn't trying to compete there — it's closer to a lightweight, purpose-built status page for a single agent run, more like posting to a Slack channel but with a persistent, shareable URL and structured status fields instead of scrolling text. Generic status…
👥 Target audience
Équipes de développement IA et responsables techniques voulant une visibilité instantanée sur des agents autonomes sans mettre en place d'infrastructure de monitoring.
🌍 Target countries
Marché anglophone, équipes IA internationales
🗣️ Available languages
EN
🔄 Alternatives
LangSmithNotifications Slack personnaliséesStatuspage.io (pages de statut classiques)
The short version: mcpbeat fills a genuinely new gap — nobody was independently tracking whether MCP servers actually stay up — and does it with real, frequent live checks rather than a popularity proxy.
General uptime monitoring (UptimeRobot, Pingdom, Better Uptime) has existed for years but isn't purpose-built for the MCP handshake protocol or for surfacing tool-level changes (a server staying "up" while quietly removing the tool you depend on). mcpbeat's differentiation is protocol-specific: it verifies the actual MCP handshake, not just an HTTP 200, and tracks exposed-tool changes over ti…
👥 Target audience
Développeurs et équipes IA intégrant des serveurs MCP, mainteneurs de serveurs MCP cherchant des métriques d'adoption
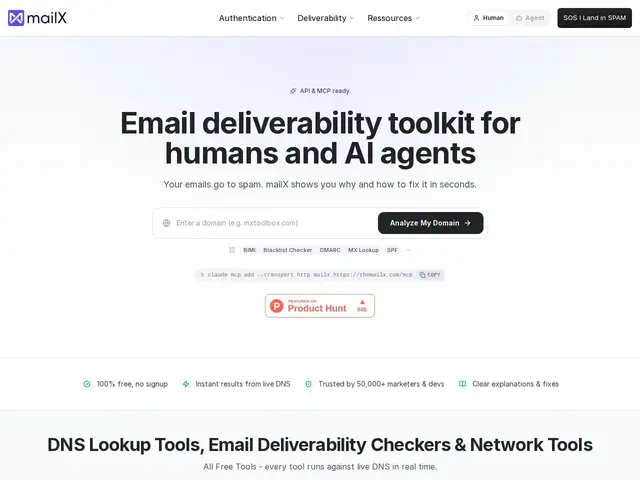
The short version: mailX takes a genuinely confusing technical problem — decoding SPF/DKIM/DMARC/blacklist status — and makes it free, fast, and readable, which is hard to argue with at this price.
DNS and email-authentication checkers have existed for years (MXToolbox is the long-standing default), but mailX's angle is plain-English remediation guidance plus native support for AI agents via an MCP server and JSON API, which fits how a growing share of technical diagnosis now happens — an agent checking domain health as part of a larger automated task rather than a human manually reading raw …
👥 Target audience
Fondateurs, équipes commerciales, marketeurs, agences et développeurs ayant besoin de diagnostiquer et corriger des problèmes de délivrabilité email
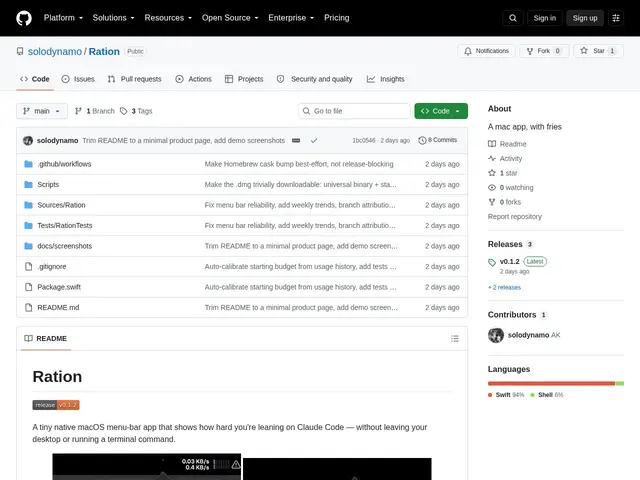
The short version: a small, focused, genuinely useful utility for a specific and growing pain point — not knowing how much AI coding usage is costing you until it's too late.
There isn't much direct competition for a dedicated Claude Code usage tracker; the alternative is manually running terminal commands or checking billing dashboards, both of which require remembering to check. Ration's edge is passive visibility (a menu-bar ring you glance at) plus 100% local processing, so there's no privacy trade-off for the convenience. The obvious limitation is platform lock-in (macOS only) and scope …
👥 Target audience
Développeurs macOS utilisant Claude Code souhaitant surveiller leur consommation sans quitter le bureau.
🌍 Target countries
Marché anglophone international, utilisateurs Claude Code
🗣️ Available languages
EN
🔄 Alternatives
Commandes terminal manuelles pour vérifier l'usageTableaux de bord de facturation Anthropic
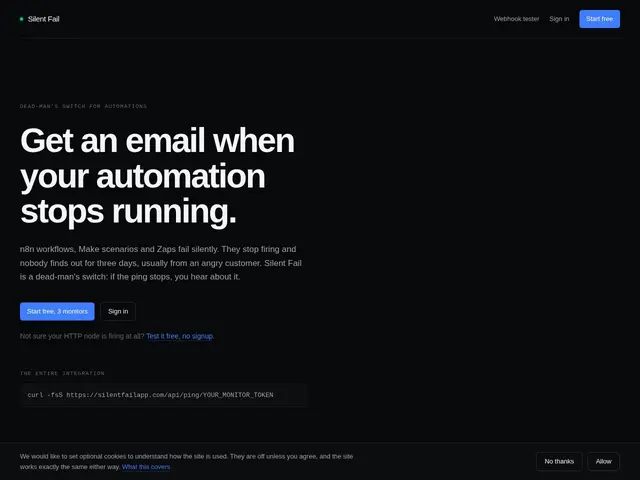
The short version: Silent Fail is a cheap, focused fix for a real blind spot in no-code automation — silent workflow failures — and its free tier makes it an easy first try before you decide if you need more.
Healthchecks.io pioneered this dead-man's-switch pattern and remains the most established option, with a mature free tier and broad ecosystem support beyond just automation platforms; Cronitor covers similar ground with more general cron/job monitoring. Silent Fail's pitch is narrower and more approachable: it's built specifically with n8n/Make/Zapier users in mind, rather than requiring…
👥 Target audience
Opérateurs d'automatisation individuels et agences utilisant n8n, Make ou Zapier
🌍 Target countries
Marché anglophone, communauté no-code/automatisation internationale
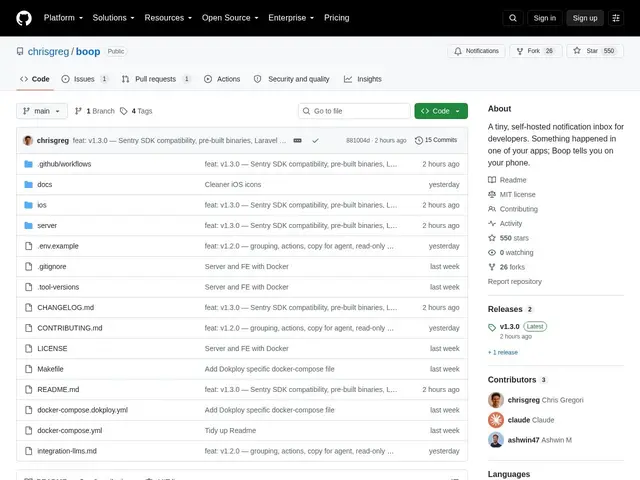
The short version: Boop is a genuinely simple, free, privacy-respecting way to get push notifications from your own backend without handing your error data to a third-party SaaS.
The closest alternatives are Gotify, ntfy, and Pushover, all self-hostable or low-cost push notification tools, but none of them speak the Sentry DSN protocol natively or ship a dedicated iOS app with rich action buttons the way Boop does. Since it's open source and self-hosted, there's no recurring cost, and no data leaves your own infrastructure, a real advantage over commercial error-tracking tools that route ever…
👥 Target audience
Développeurs et petites équipes gérant des applications en production