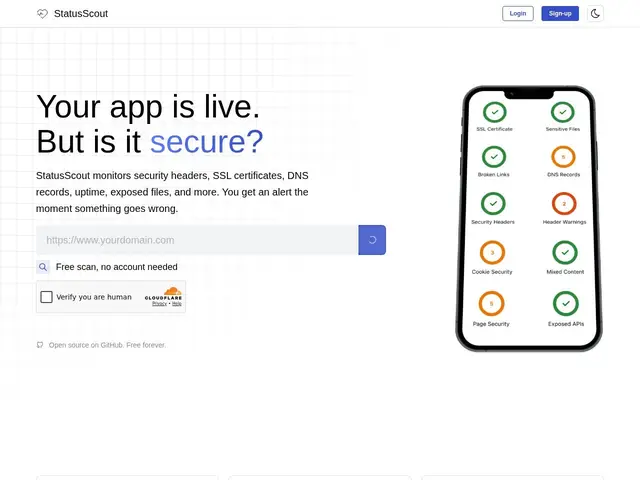
Open-source security and uptime monitoring that scans for missing security headers, expiring SSL certs, exposed secrets, and downtime.
statusscout.dev
Testing whether your monitoring dashboards, alerting rules, and tracing UI actually work well requires real traffic patterns — but standing up 20+ microservices just to generate test data is its own project. Snowglobe skips the real infrastructure entirely: it's a single small program that emits realistic OpenTelemetry logs, traces, and metrics as if a full distributed system were running, complete with the messy failures real systems produce. It simulates up to 28 services (20 e-commerce-style plus 8 AI-focused) across 40 scenario flows, injecting the kind of problems that make observability tools earn their keep: lost messages, retry storms, rate limiting, saga compensation, timeout cascades, and general chaos scenarios. The AI-focused services emit spans following GenAI semantic conventions, so it's also useful for validating LLM-tracing tools specifically. It compiles to a single 6.4MB container with zero external dependencies, and you can tune complexity, throughput (2 to 350 traces per second), and error rates to match whatever load profile you're testing against. It's open source (Apache 2.0), actively maintained (69 commits, 17 stars, 2 forks at time of review), and completely free.
| # | Tool | Best for | Price |
|---|---|---|---|
| 1 | Developers, freelancers, and agencies monitoring uptime and security posture for client sites | — | |
| 2 | DevOps/SRE teams, especially in regulated/data-residency-constrained environments | — | |
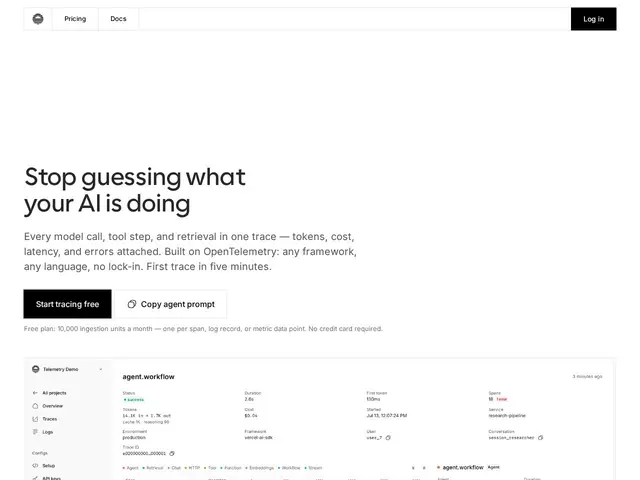
| 3 | Developers and engineers building AI applications needing production observability | — | |
| 4 | Teams wanting self-hosted uptime monitoring with fewer false alarms | — | |
| 5 | Développeurs et équipes techniques voulant surveiller le web en continu sans dépendre d'un seul moteur de recherche | — | |
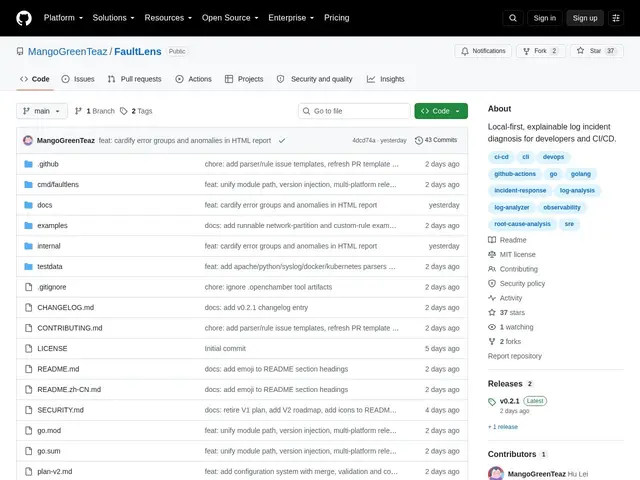
| 6 | Développeurs et équipes CI/CD voulant diagnostiquer des incidents localement sans envoyer leurs logs dans le cloud | — | |
| 7 | Équipes DevOps et self-hosters gérant quelques serveurs/containers qui veulent un tableau de bord de disponibilité | — | |
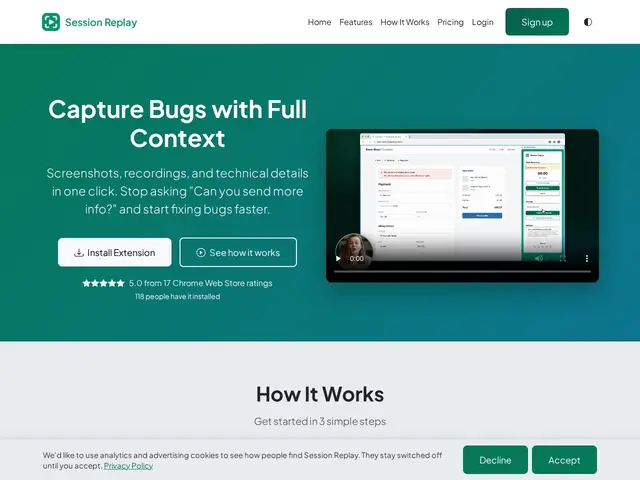
| 8 | Équipes QA, développeurs et support technique qui reçoivent des rapports de bugs imprécis de la part de non-techniciens | — | |
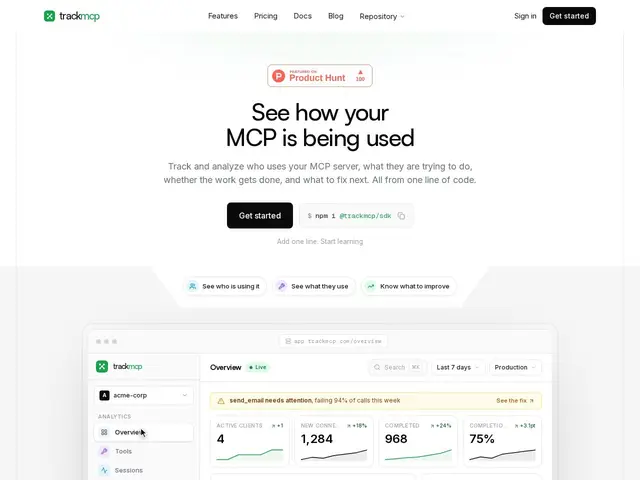
| 9 | Développeurs et mainteneurs de serveurs MCP voulant des analyses d'usage et de fiabilité | — | |
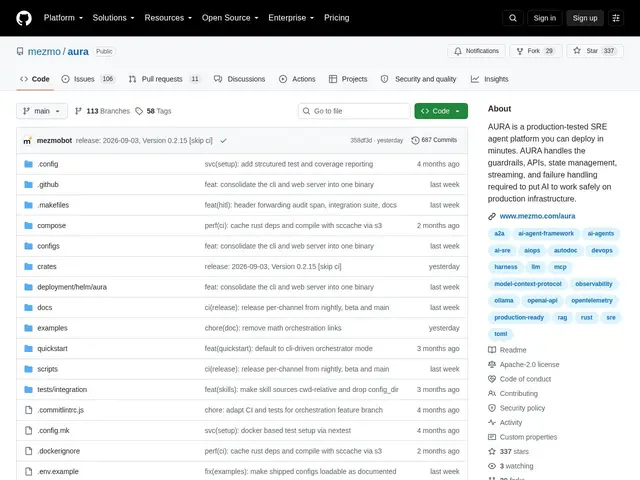
| 10 | Équipes SRE et ops voulant expérimenter la réponse aux incidents assistée par IA avec des garde-fous | — | |
| 11 | Équipes construisant des applications LLM/agents ayant besoin de tracer coûts et performance des appels modèles | — | |
| 12 | Ingénieurs IA et développeurs utilisant Claude Code ou Codex qui veulent auditer le raisonnement de l'agent en temps réel. | — |
Open-source security and uptime monitoring that scans for missing security headers, expiring SSL certs, exposed secrets, and downtime.
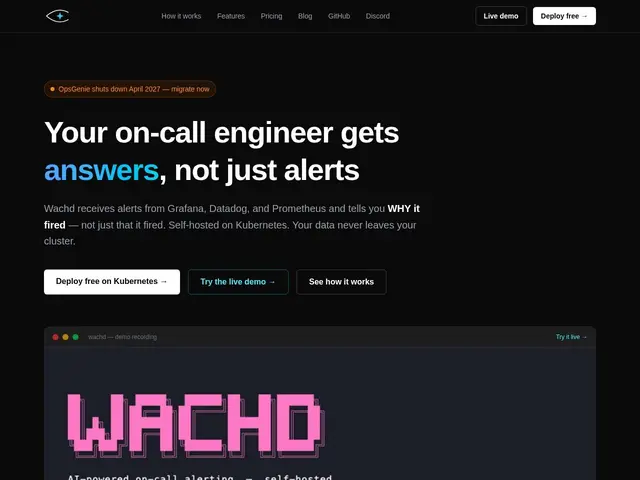
Self-hosted, AI-powered root cause analysis for on-call alerts from Grafana, Datadog and Prometheus.
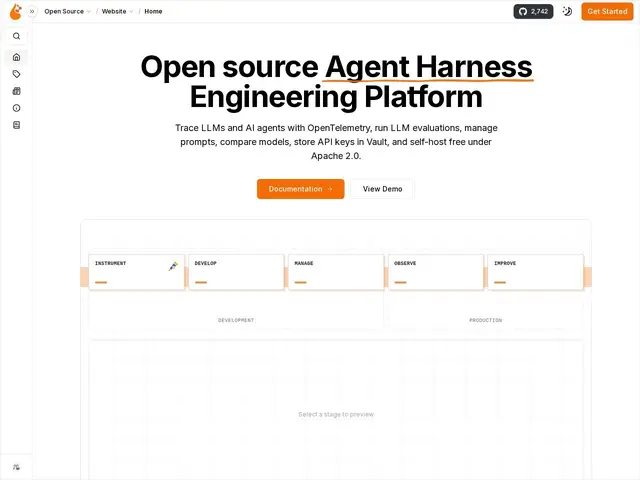
Open-source, self-hosted observability platform for LLM applications, built on OpenTelemetry.
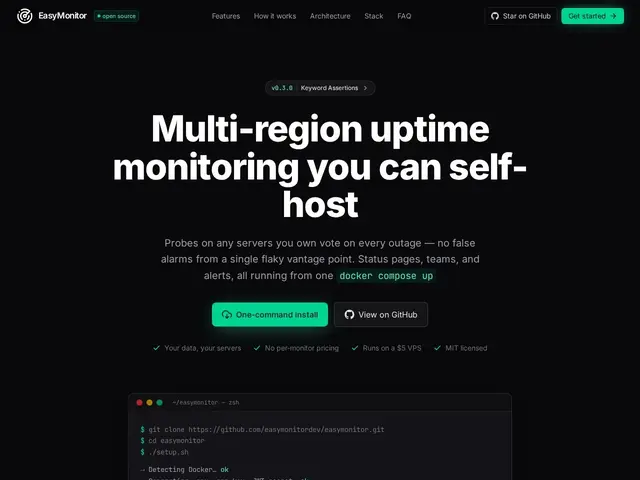
Self-hosted uptime monitoring with multi-region quorum voting to cut false alarms.
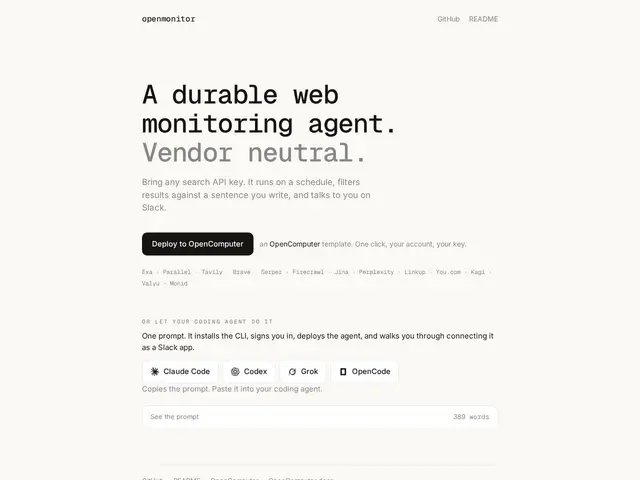
An open-source cloud agent that keeps re-running a web search on a schedule across 13+ search providers, and pings Slack or a webhook only when something new matches your criteria.
A local-first, offline log analysis tool written in Go that turns raw application logs into structured incident diagnoses with evidence-based root-cause hypotheses.
A lightweight, self-hosted service health dashboard written in Go that auto-discovers Docker containers and monitors uptime via heartbeats and active HTTP/TCP/ICMP checks.
Chrome extension that captures a screenshot, video, console logs, and network details of a bug in one click, no manual writeup needed
One-line analytics integration for MCP servers, showing which AI clients connect, tool adoption, and silent failures
Open-source platform for letting AI agents safely investigate and respond to production incidents, with built-in guardrails
Observability platform purpose-built for tracing and cost-tracking LLM applications
A local proxy that lets Claude Code or Codex display their reasoning on a dashboard, so you can see what the model is actually deciding — and rejecting — while it works.