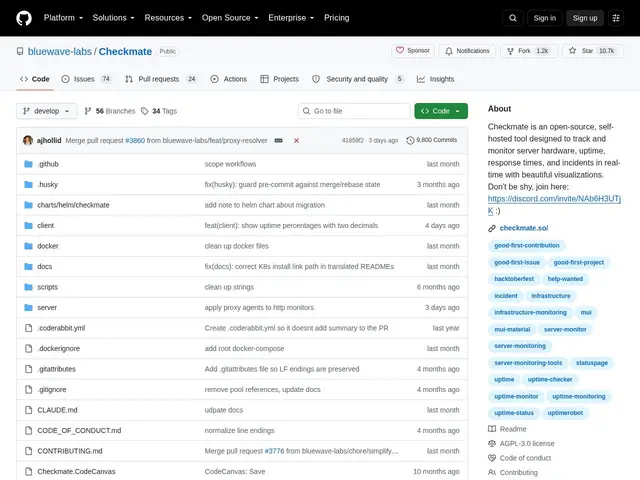
Free, self-hosted uptime and server monitoring with a modern dashboard, themed status pages, and 15+ notification channels.
github.com
Most monitoring tools want you to click through a web UI to set up every check, which works fine until you need to review who changed what, or replicate the exact same setup on a second server. Gatus takes a different approach: every monitor, alert, and status page is defined in a YAML file, so it lives in Git alongside the rest of the infrastructure code, reviewable in a pull request like anything else. Gatus is a self-hosted, open-source health monitoring and status-page tool aimed at development and DevOps teams who want their monitoring configuration to be version-controlled infrastructure-as-code rather than clicks in a dashboard. It handles automated uptime tracking, incident and alert management, and generates a public or internal status page, all driven by the same YAML config. It deploys via Docker, is Apache-2.0 licensed, and has built up a substantial community with nearly 12,000 GitHub stars.
| # | Tool | Best for | Price |
|---|---|---|---|
| 1 | Équipes DevOps, infrastructure, PME et particuliers voulant un monitoring auto-hébergé complet | — | |
| 2 | Développeurs | — | |
| 3 | Développeurs | — | |
| 4 | Developers, freelancers, and agencies monitoring uptime and security posture for client sites | — | |
| 5 | DevOps/SRE teams, especially in regulated/data-residency-constrained environments | — | |
| 6 | Developers and engineers building AI applications needing production observability | — | |
| 7 | Teams wanting self-hosted uptime monitoring with fewer false alarms | — | |
| 8 | Développeurs et équipes techniques voulant surveiller le web en continu sans dépendre d'un seul moteur de recherche | — | |
| 9 | Développeurs et équipes CI/CD voulant diagnostiquer des incidents localement sans envoyer leurs logs dans le cloud | — | |
| 10 | Équipes DevOps et self-hosters gérant quelques serveurs/containers qui veulent un tableau de bord de disponibilité | — | |
| 11 | Équipes QA, développeurs et support technique qui reçoivent des rapports de bugs imprécis de la part de non-techniciens | — | |
| 12 | Développeurs et mainteneurs de serveurs MCP voulant des analyses d'usage et de fiabilité | — |
Free, self-hosted uptime and server monitoring with a modern dashboard, themed status pages, and 15+ notification channels.
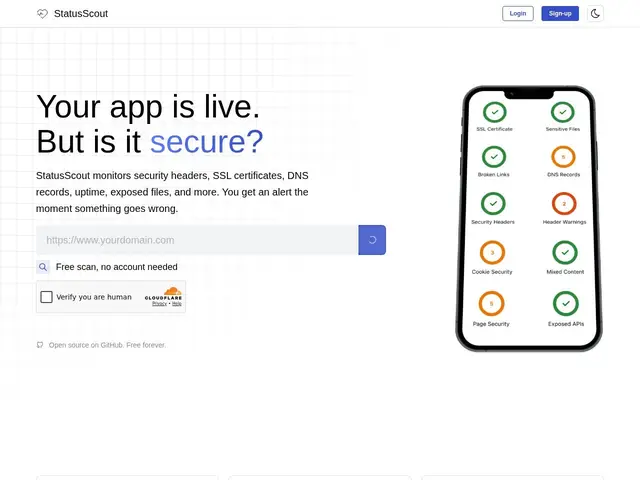
Open-source security and uptime monitoring that scans for missing security headers, expiring SSL certs, exposed secrets, and downtime.
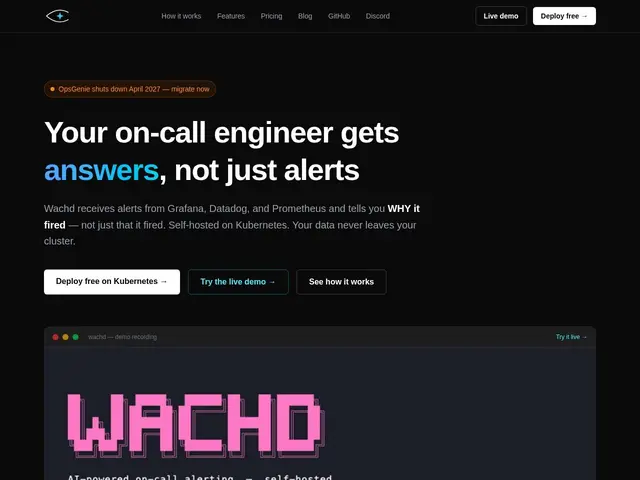
Self-hosted, AI-powered root cause analysis for on-call alerts from Grafana, Datadog and Prometheus.
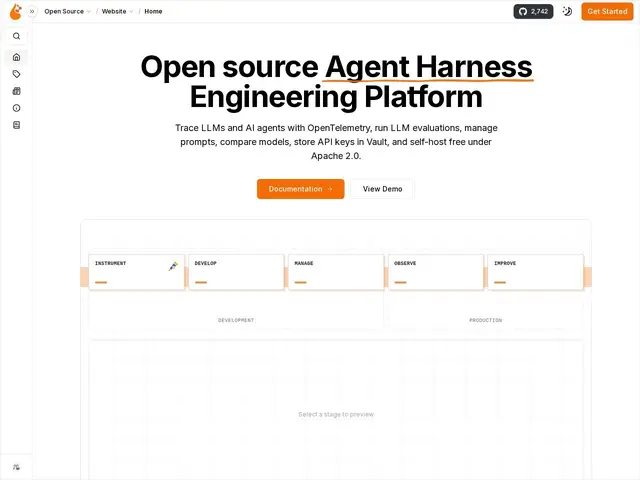
Open-source, self-hosted observability platform for LLM applications, built on OpenTelemetry.
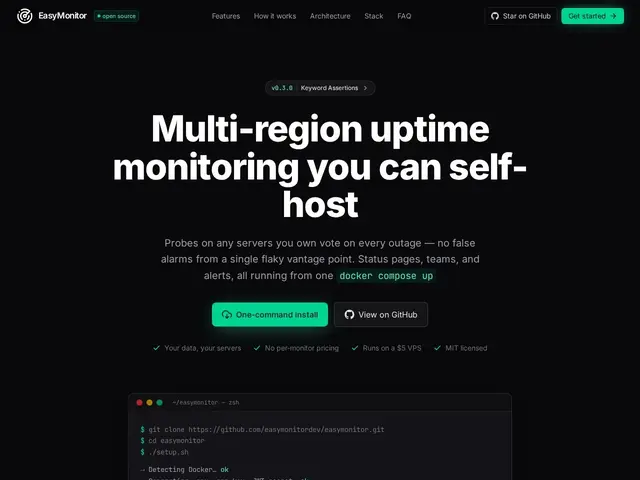
Self-hosted uptime monitoring with multi-region quorum voting to cut false alarms.
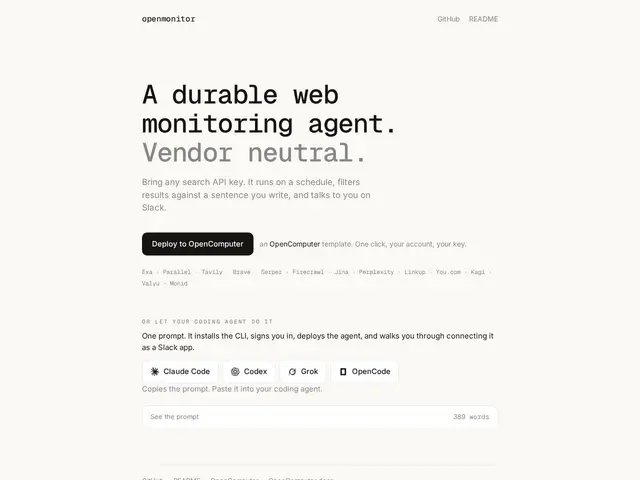
An open-source cloud agent that keeps re-running a web search on a schedule across 13+ search providers, and pings Slack or a webhook only when something new matches your criteria.
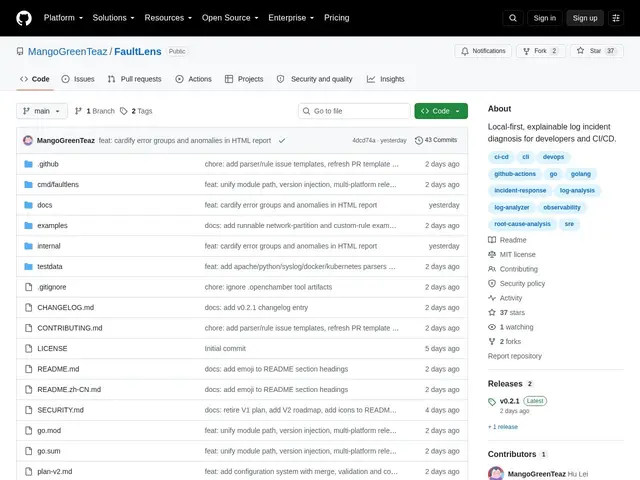
A local-first, offline log analysis tool written in Go that turns raw application logs into structured incident diagnoses with evidence-based root-cause hypotheses.
A lightweight, self-hosted service health dashboard written in Go that auto-discovers Docker containers and monitors uptime via heartbeats and active HTTP/TCP/ICMP checks.
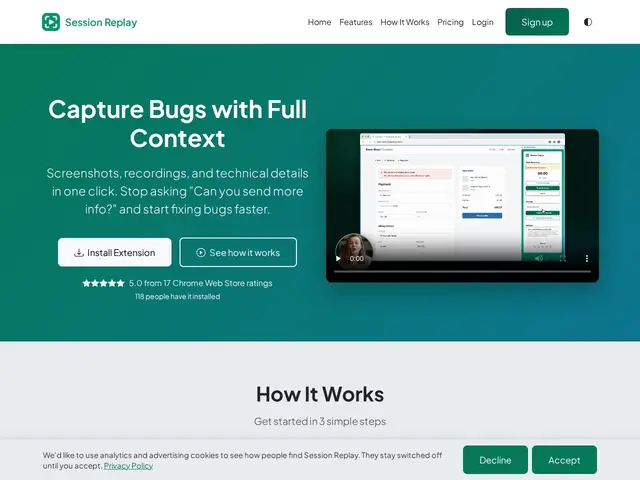
Chrome extension that captures a screenshot, video, console logs, and network details of a bug in one click, no manual writeup needed
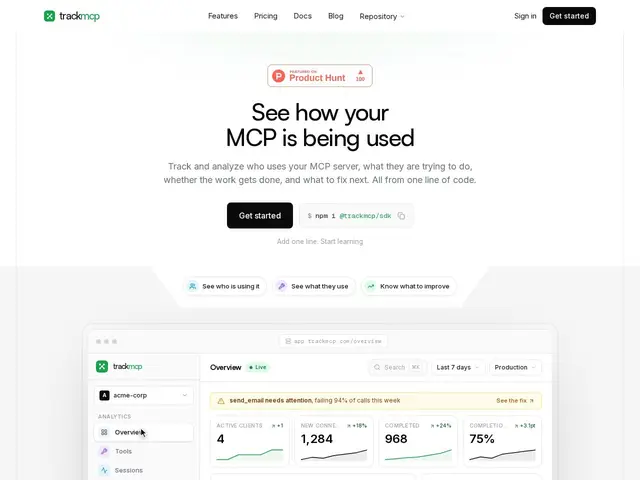
One-line analytics integration for MCP servers, showing which AI clients connect, tool adoption, and silent failures