tcpdump
danielmiessler.com
Wireshark is the standard tool for inspecting network traffic, but it needs a graphical environment, which is awkward on a headless server or inside a container where most real debugging happens today. pktscope brings that same three-pane experience — packet list, protocol details, hex view — into a terminal you can SSH into, which matters a lot more than it sounds once you're troubleshooting a production box with no desktop. It captures traffic using eBPF/TCX hooks rather than the traditional pcap approach, which lets it observe passively and filter in-kernel for better performance, and it specifically handles raw-IP tunnel interfaces (tunl0, WireGuard, GRE) that traditional tools often struggle to decode cleanly. It supports interactive keyboard and mouse navigation within the terminal UI and display filtering by protocol, aiming at the same debugging workflow as Wireshark or tcpdump but without needing a GUI or a separate machine to view the capture.
| # | Tool | Best for | Price |
|---|---|---|---|
| 1 | Développeurs | — | |
| 2 | Administrateurs réseau | Développeurs | — | |
| 3 | Informatique | — | |
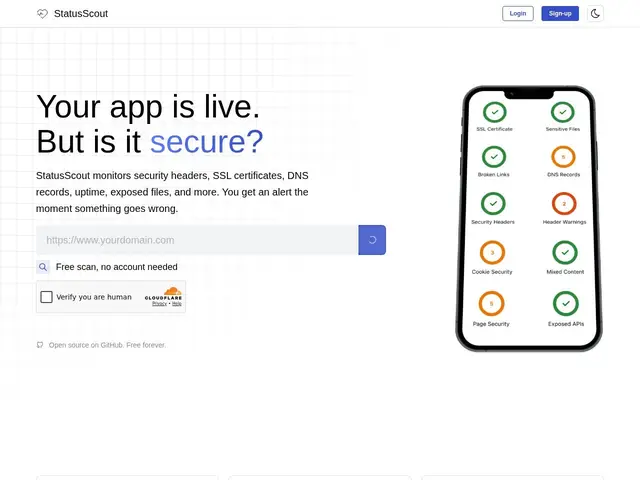
| 4 | Developers, freelancers, and agencies monitoring uptime and security posture for client sites | — | |
| 5 | DevOps/SRE teams, especially in regulated/data-residency-constrained environments | — | |
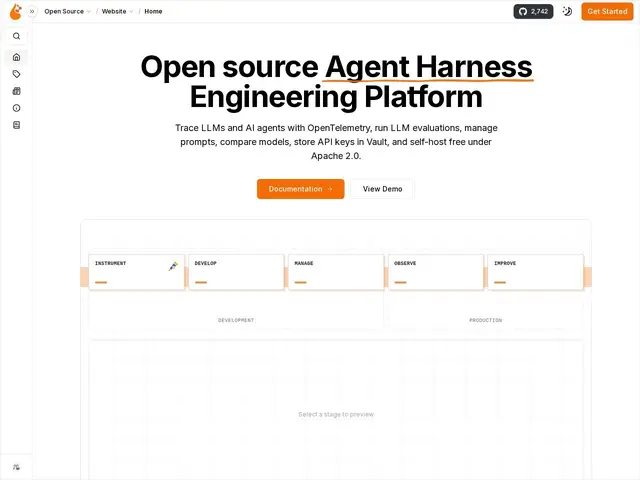
| 6 | Developers and engineers building AI applications needing production observability | — | |
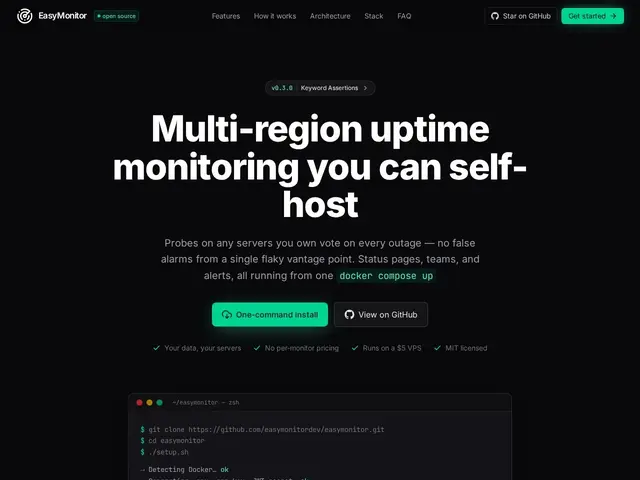
| 7 | Teams wanting self-hosted uptime monitoring with fewer false alarms | — | |
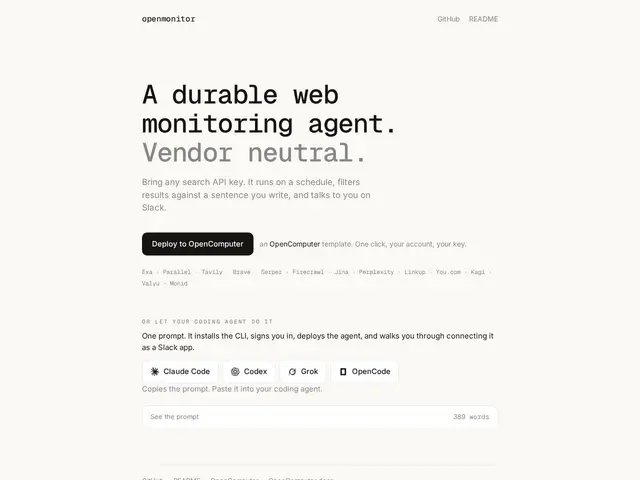
| 8 | Développeurs et équipes techniques voulant surveiller le web en continu sans dépendre d'un seul moteur de recherche | — | |
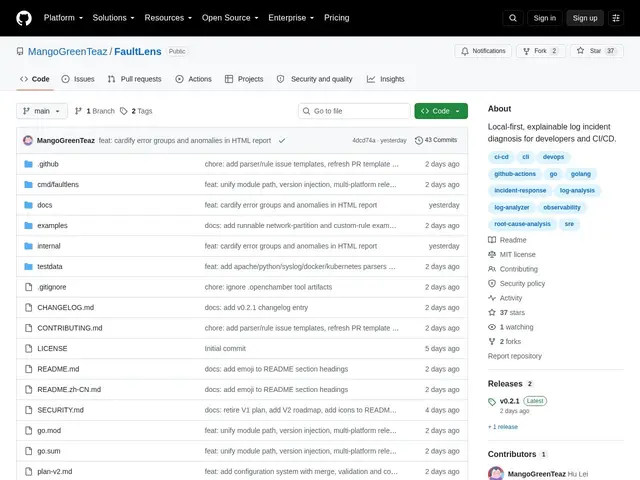
| 9 | Développeurs et équipes CI/CD voulant diagnostiquer des incidents localement sans envoyer leurs logs dans le cloud | — | |
| 10 | Équipes DevOps et self-hosters gérant quelques serveurs/containers qui veulent un tableau de bord de disponibilité | — | |
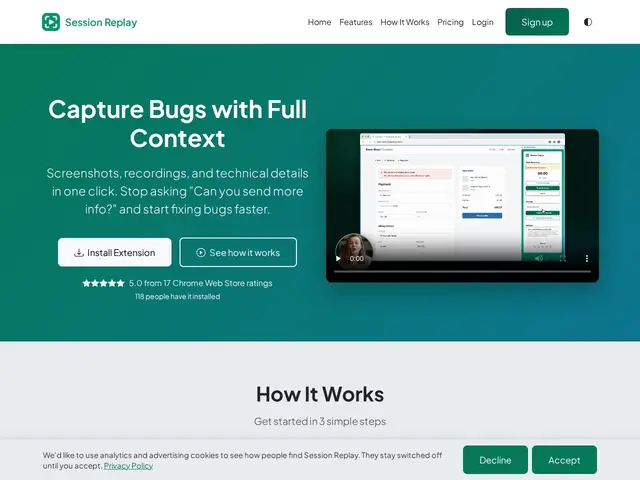
| 11 | Équipes QA, développeurs et support technique qui reçoivent des rapports de bugs imprécis de la part de non-techniciens | — | |
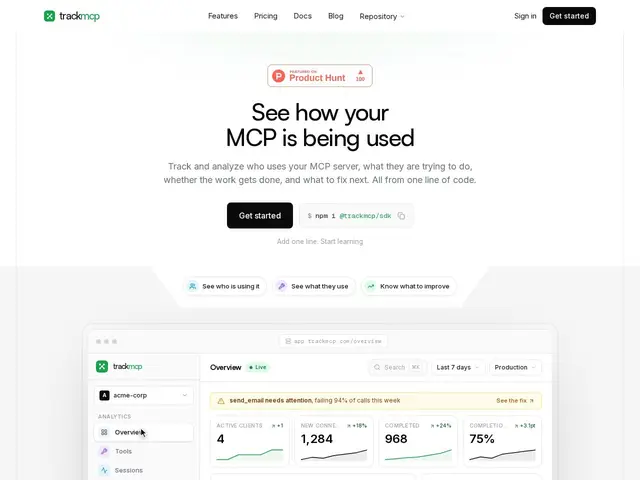
| 12 | Développeurs et mainteneurs de serveurs MCP voulant des analyses d'usage et de fiabilité | — |
Open-source security and uptime monitoring that scans for missing security headers, expiring SSL certs, exposed secrets, and downtime.
Self-hosted, AI-powered root cause analysis for on-call alerts from Grafana, Datadog and Prometheus.
Open-source, self-hosted observability platform for LLM applications, built on OpenTelemetry.
Self-hosted uptime monitoring with multi-region quorum voting to cut false alarms.
An open-source cloud agent that keeps re-running a web search on a schedule across 13+ search providers, and pings Slack or a webhook only when something new matches your criteria.
A local-first, offline log analysis tool written in Go that turns raw application logs into structured incident diagnoses with evidence-based root-cause hypotheses.
A lightweight, self-hosted service health dashboard written in Go that auto-discovers Docker containers and monitors uptime via heartbeats and active HTTP/TCP/ICMP checks.
Chrome extension that captures a screenshot, video, console logs, and network details of a bug in one click, no manual writeup needed
One-line analytics integration for MCP servers, showing which AI clients connect, tool adoption, and silent failures