ClassTrace Explorer
An open-source command-line tool that captures what happens when a Java program loads its classes at startup, and turns that into an interactive graph you can explore in a browser.
🔗 Visit ClassTrace Explorer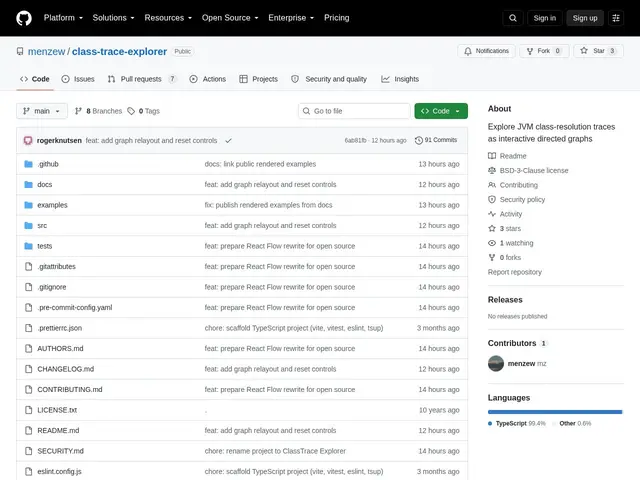
Description
Every time a Java program starts up, it has to load and resolve hundreds or thousands of "classes" — the building blocks of the code — often in an order that's invisible to the developer running it. ClassTrace Explorer is a bit like a flight recorder for that invisible startup phase: it watches which classes get loaded, when, and by what, then turns that raw data into a picture you can actually look at and click through, instead of a wall of log text. It's aimed at Java developers who've ever wondered why their app is loading a library at startup, or how tangled their dependencies really are.
Under the hood, it captures class-resolution activity using JDK 9+'s unified logging (with support for legacy JDK 8 trace formats too), then builds a self-contained HTML report with an interactive directed graph rendered via React Flow — no server needed, just open the file. Classes are automatically classified by origin (application code, JDK system classes, third-party dependencies, or unknown/mixed), and the graph supports drag-and-drop relayout, search, and dynamic filtering by origin or class name, down to individual inner classes and lambdas. It also includes a bytecode footprint comparison feature. It ships as a Node.js CLI (clgrapher run to capture, clgrapher graph to render) under the permissive BSD 3-Clause license.
💬 Our review
The short version: a clever, honestly useful idea for Java developers chasing startup-time mysteries, but it's a brand-new, tiny project you should treat as an experiment, not a mature tool.
ClassTrace Explorer doesn't really compete with general-purpose profilers like VisualVM or Java Flight Recorder (JFR), which measure CPU/memory over an app's whole lifetime — its niche is the class-loading graph specifically at startup, a blind spot those tools don't visualize well. JITWatch is probably the closest comparison, since it also turns low-level JVM internals into an explorable UI. The strength here is the idea and output format: a single portable HTML file with a real interactive graph beats parsing raw class-load log output by hand. The weakness is maturity — 3 stars, no forks, and no evidence yet of production use beyond the author's own testing, so expect rough edges and no guarantee of long-term maintenance. It's free and open source, so there's no cost decision to make — the real cost is your time evaluating whether it works on your codebase.
💰 Pricing
📊 Global score
🤖 AI-enriched data
Free and open source (BSD 3-Clause) — no paid tier, self-hosted CLI only, no hosted SaaS version
Pros
Free and open source under a permissive BSD 3-Clause license
Turns opaque JVM class-loading logs into a real interactive, explorable graph
Self-contained HTML output — no server or account needed to view results
Supports both modern JDK 9+ unified logs and legacy JDK 8 traces
Cons
Very early-stage project — only 3 GitHub stars, 0 forks, unproven in production
No hosted or GUI-installed version — requires Node.js and CLI comfort
Narrow scope: only class-loading, not general CPU/memory profiling
Single/small maintainer team, so long-term support is uncertain