Beszel
A free, open-source tool that watches your servers — CPU, memory, disk, Docker containers, even temperature — and alerts you when something's wrong, without the resource overhead of heavier monitoring stacks.
🔗 Visit Beszel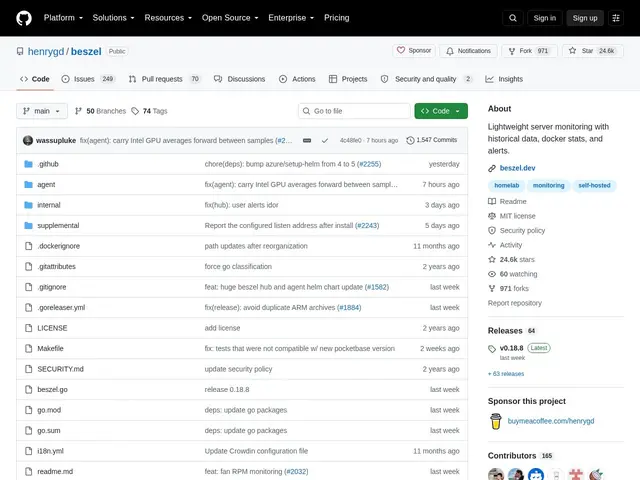
Description
Full-featured monitoring stacks like Grafana plus Prometheus are powerful but heavy to set up and run, which is overkill if you just want to know when a server is running hot or a Docker container has crashed. Beszel is built for that simpler need: lightweight, fast to deploy, and focused on the metrics that actually matter for keeping servers healthy.
Beszel is a free, open-source (MIT) monitoring platform with a hub-and-agent architecture (built on PocketBase) that tracks CPU, memory, disk and network usage, Docker container stats, temperature, fan speed, GPU usage, battery level and S.M.A.R.T. disk health, all with historical data retention. It supports multiple users with OAuth/OIDC authentication, customizable alerts, and automated backups to S3 or local disk. It's grown to over 24,000 GitHub stars, reflecting strong adoption in the homelab and self-hosting community.
💬 Our review
The short version: if you run your own servers (homelab, VPS fleet, self-hosted apps) and want to know when something breaks without standing up a full Grafana/Prometheus stack, Beszel is a genuinely lighter, faster-to-deploy alternative that still covers the metrics that matter.
The differentiator versus Grafana + Prometheus is scope and simplicity: that combination is extremely powerful and infinitely customizable, but it takes real setup time and ongoing maintenance to run well. Beszel deliberately trades some of that flexibility for a monitoring tool you can deploy in minutes and mostly forget about. Compared to Uptime Kuma, which focuses on uptime/availability checks, Beszel goes deeper into actual resource metrics (CPU, memory, disk, temperature, GPU, S.M.A.R.T. health) rather than just "is it up." Its Docker container tracking and hardware health monitoring (S.M.A.R.T., temperature, fan) are particularly strong for homelab and self-hosted server admins.
The honest limits: the hub-and-agent architecture means you're deploying and maintaining two components instead of one, which is more setup than a single-binary tool, and there's no commercial support or hosted SaaS option if you'd rather not self-host at all. For homelab users and small ops teams wanting solid server monitoring without Prometheus-level complexity, it's an excellent free choice; for large enterprise infrastructure needing deep customization and integrations, Grafana's ecosystem is still the more capable (if heavier) option.
💰 Pricing
📊 Global score
🤖 AI-enriched data
Outil open-source (MIT), entièrement gratuit et auto-hébergé.
Pros
Léger et rapide à déployer, contrairement à une stack Grafana + Prometheus complète
Suivi des conteneurs Docker et de la santé matérielle (température, ventilateurs, S.M.A.R.T.)
Multi-utilisateur avec authentification OAuth/OIDC, alertes personnalisables
Gratuit, open-source (MIT), sauvegardes automatiques S3/disque
Cons
Architecture hub + agent — deux composants à déployer et maintenir
Aucune offre SaaS hébergée ni support commercial
Moins personnalisable qu'un écosystème Grafana complet pour de gros besoins