Homelable
A free, self-hosted tool that scans a home network and draws it as an interactive, live-status diagram, so you can actually see what's running where.
🔗 Visit Homelable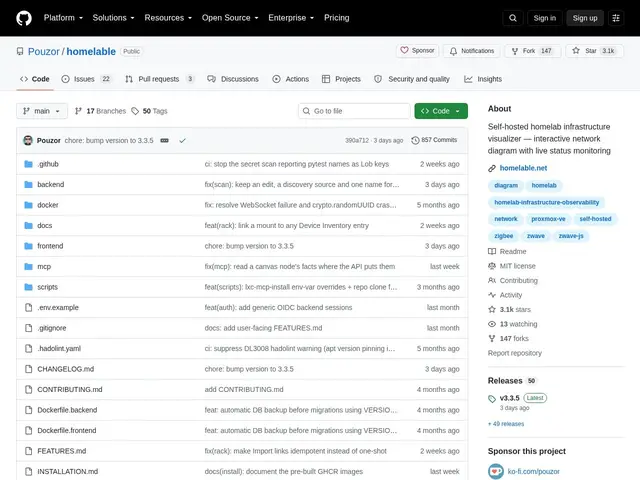
Description
Anyone running more than a handful of self-hosted services at home eventually loses track of what's running where — which device does what, which port forwards to which container, which box just went offline. Homelable is a free, self-hosted tool that draws that mess out as an actual interactive diagram: it scans your network, finds your devices, and keeps a live, visual map of what's online and what isn't.
It uses nmap to discover devices and fingerprint services, then monitors each one's live status via ping, HTTP/HTTPS, TCP, SSH, or Prometheus checks. Beyond a flat network map, it supports a "rack canvas" for mapping physical server racks and cabling, multiple canvases for different floor plans, and can import devices directly from Zigbee2MQTT, Z-Wave JS UI, and Proxmox VE. A read-only "Live View" lets you share a canvas publicly, and an MCP server lets AI assistants like Claude query your infrastructure map. MIT-licensed, deployed via Docker, with 3,000+ GitHub stars.
💬 Our review
The short version: if your homelab has grown past the point where you can keep it in your head, Homelable turns it into an actual map you can look at — and it's free.
Compared to a general-purpose dashboard like Homepage or a full monitoring stack like Prometheus + Grafana, Homelable's specific angle is visual topology — showing you how devices physically and logically connect, rather than just listing services or graphing metrics over time. That makes it complementary to, not a replacement for, a metrics stack: use Prometheus/Grafana for historical graphs and alerting depth, and Homelable for the "what's actually plugged into what" picture. Network scanning needing root/NET_RAW privileges is a normal but real friction point for less technical users, and the official homepage returning a 403 error means GitHub is currently the only reliable source of information — a rough edge worth knowing about before installing.
💰 Pricing
📊 Global score
🤖 AI-enriched data
100% gratuit, licence MIT, auto-hébergé (Docker). Aucune version payante.
Pros
Cartographie visuelle interactive du réseau, pas juste une liste de services
Six méthodes de vérification de statut (ping, HTTP, TCP, SSH, Prometheus...)
Import direct depuis Zigbee2MQTT, Z-Wave JS UI et Proxmox VE
Canvas dédié aux racks physiques pour le câblage et le montage
Serveur MCP pour interroger son infra via un assistant IA
Cons
Le scan réseau nécessite des privilèges root/NET_RAW sur Linux
Ne remplace pas une stack de métriques complète (Prometheus/Grafana) pour l'historique et l'alerting
Site officiel (homelable.net) renvoie une erreur 403 — GitHub reste la seule source fiable
Scan HTTP approfondi désactivé par défaut, configuration manuelle requise