mcpsnoop
A tool that shows you exactly what your AI coding assistant is really saying to its plugins (MCP servers) behind the scenes — instead of guessing why a tool call went wrong, you can watch the actual traffic live, like a network sniffer for AI agents.
🔗 Visit mcpsnoop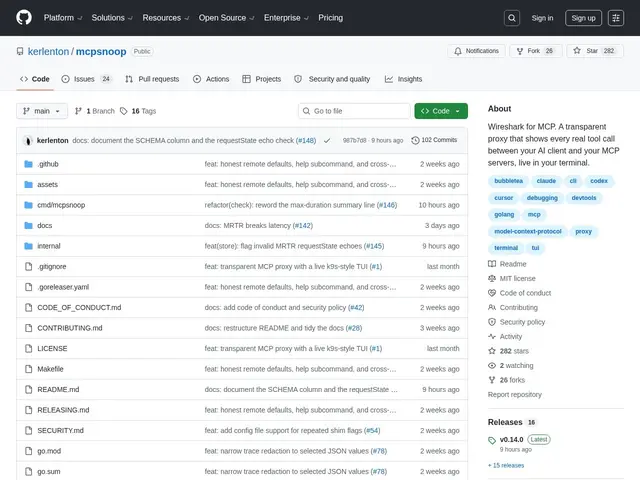
Description
When an AI coding assistant calls a plugin (an MCP server) to do something — say, query a database or run a search — and it doesn't behave as expected, debugging that is normally guesswork: you don't see the actual request the assistant sent or the exact response it got back. mcpsnoop fixes that by sitting directly in the data path between your AI client and its MCP servers, so you can watch the real JSON-RPC traffic live in your terminal, the same way a network engineer would use Wireshark to inspect network packets.
mcpsnoop is a free, open-source (MIT) transparent proxy, described by its creator as "Wireshark for MCP." Unlike the official MCP Inspector — which connects as its own separate client and therefore never sees what your actual client (Cursor, Claude Code, Codex) sent — mcpsnoop intercepts the real traffic itself, showing every JSON-RPC frame, server stderr output, slow requests, and hung calls as they happen. It also supports replaying captured tool calls and filtering streams with query tokens, and installs via Homebrew or GitHub releases.
💬 Our review
The short version: if you build or debug MCP servers and have ever been stuck wondering why a tool call silently failed or returned the wrong thing, mcpsnoop shows you the actual wire traffic instead of leaving you to guess — and it's completely free.
Its key differentiator against the official MCP Inspector is architectural: Inspector connects as its own separate client, so it structurally can't see what your real client (Cursor, Claude Code) actually sent, including malformed calls the model never should have made. mcpsnoop sits directly in the real data path, so it sees exactly what happened, which is a meaningfully more accurate debugging view. The tradeoff is that it's a narrow, single-purpose CLI tool — it won't help with anything beyond MCP traffic inspection, and as a very new project (released July 2026), it hasn't had much time to be battle-tested against edge cases the way a more established tool would. Great fit for anyone actively building MCP servers or extensions and needing to debug real client-server interactions; overkill if you're just using MCP tools as an end user without building your own.
📊 Global score
🤖 AI-enriched data
100% gratuit et open source (licence MIT)
Pros
Voit le trafic réel dans le vrai chemin de données, contrairement à MCP Inspector qui se connecte comme un client séparé
100% gratuit et open source (MIT)
Support du replay d'appels capturés et du filtrage par tokens de requête
Installation simple via Homebrew ou releases GitHub
Cons
Outil très ciblé, ne sert qu'à l'inspection du trafic MCP
Projet très récent (juillet 2026), pas encore éprouvé sur la durée
Utile uniquement pour ceux qui construisent/déboguent des serveurs MCP, pas pour l'utilisateur final
Pas d'interface graphique, terminal uniquement