AMC Stocks Hub
A data platform that aggregates SEC Form 13F filings from 550+ institutional asset managers so investors can see what big funds are buying, selling, and holding in common.
🔗 Visit AMC Stocks Hub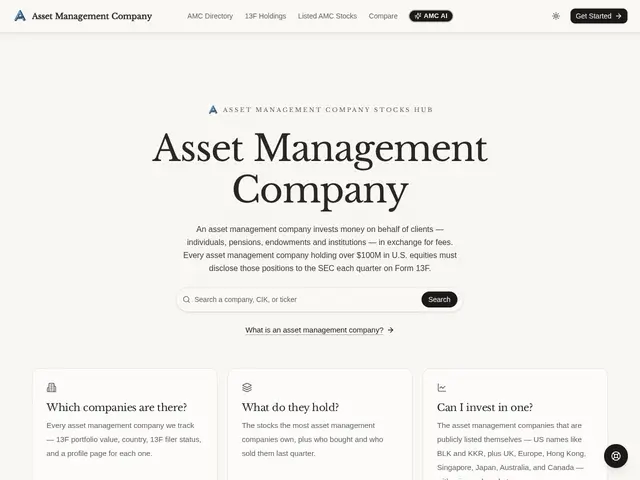
Description
Every quarter, big institutional investors — hedge funds, pension funds, large asset managers — are legally required to disclose what stocks they hold, through a filing called Form 13F. That data is public, but it's scattered across thousands of raw SEC documents that are painful to read one by one. AMC Stocks Hub is essentially a leaderboard for that disclosure: it pulls together 13F filings from 551+ asset managers so you can see, in one place, what institutions are doing with their money without digging through SEC EDGAR yourself.
Under the hood, it organizes each manager's quarterly holdings into searchable profiles and layers on tools that raw filings don't give you directly: a co-holdings search to find which stocks multiple managers hold at once, a consensus radar that flags when managers are broadly agreeing or diverging on a position, tracking of the largest dollar position changes quarter over quarter, sector exposure breakdowns, side-by-side manager comparison, and an AI assistant for querying the dataset in plain language. Because 13F filings are only required 45 days after quarter-end, the data here is necessarily lagged by design — this is a research and trend-spotting tool built on public disclosure data, not a real-time trading feed.
💬 Our review
The short version: AMC Stocks Hub is a reasonable way to browse institutional 13F holdings without wrestling raw SEC filings yourself, but remember that 13F data is disclosed up to 45 days late, so you're always looking at positions that may have already changed.
It competes most directly with WhaleWisdom, the longest-established 13F aggregator with both free and paid tiers, and Fintel, which offers similar institutional-ownership analytics aimed at professionals. AMC Stocks Hub's co-holdings and consensus-radar angle — seeing where multiple managers agree or disagree — is a genuinely useful framing that isn't always front-and-center on competing sites. At $19.90/month or $169/year for full historical data and CSV export, it's priced in a similar range to other niche 13F tools, though the free tier is limited enough that serious use requires paying. The core limitation is inherent to the data source, not the product: 13F filings are quarterly and lagged, so this is a tool for understanding institutional trends over time, not a source of timely trading signals.
💰 Pricing
📊 Global score
🤖 AI-enriched data
Free (limited); Monthly $19.90 (5,000 credits); Yearly $169 (60,000 credits + CSV export, about 29% savings vs monthly)
Pros
Aggregates 13F filings from 551+ asset managers into searchable profiles
Co-holdings search and consensus radar surface patterns raw filings don't show directly
CSV export and full historical quarters on the annual plan
AI assistant for querying holdings data in plain language
Cons
13F data is inherently lagged (filed up to 45 days after quarter-end)
Free tier is limited; full historical access requires a paid plan
No independent reviews found to confirm data accuracy at scale
Narrower track record than established players like WhaleWisdom