ShotSweep
A command-line visual regression testing tool that screenshots your site across viewports and flags pixel-level changes in CI, without a hosted dashboard.
🔗 Visit ShotSweep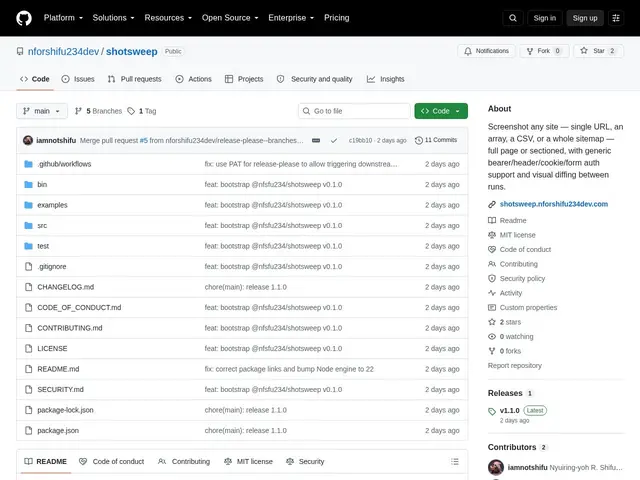
Description
Catching a broken layout or an accidentally-changed button color usually means someone has to notice it by eye, because most automated tests check that code runs, not that the page still looks right. ShotSweep automates that visual check: it takes real browser screenshots of your pages before and after a change and tells you exactly which pixels moved, so a regression that a functional test would never catch gets flagged automatically.
It runs from the command line and accepts input from a URL list, sitemap, CSV, or JSON, capturing at multiple viewport presets (desktop, tablet, mobile) with full-page or sectioned modes, and supports authenticated pages via form login, bearer tokens, headers, or cookies. Comparisons use pixel-based diffing with configurable thresholds, and results are output as machine-readable JSON (plus AI-ready summaries), which makes it straightforward to wire into a CI/CD pipeline without needing a separate hosted visual-testing service.
💬 Our review
The short version: a solid, no-frills option if you want visual regression testing inside your own CI pipeline and don't want to pay for or depend on a third-party SaaS dashboard — the trade-off is you also don't get that dashboard's polish or history browsing.
Its real strength is being self-contained and CI-native: multi-input sources, multi-viewport capture, and authenticated-page support cover most real-world sites, and machine-readable JSON output means it slots into an existing pipeline rather than forcing you into someone else's UI. Compared to hosted visual-testing SaaS products, you lose a shared web dashboard for browsing diff history across a team, and as a young open-source project built on Playwright, you're trusting a smaller maintainer base than an established commercial visual-testing tool — worth it if CI-native and free matters more than a polished dashboard.
💰 Pricing
📊 Global score
🤖 AI-enriched data
Open source sous licence MIT, installable via npm.
Pros
Fonctionne en ligne de commande, s'intègre directement dans une pipeline CI/CD
Multiples sources d'entrée (URL, sitemap, CSV, JSON) et viewports
Support de pages authentifiées (login, tokens, cookies)
Sortie JSON exploitable par machine, gratuit et open source
Cons
Pas de dashboard web partagé pour parcourir l'historique des diffs en équipe
Projet récent, écosystème plus restreint qu'un outil SaaS établi
Basé sur Playwright — dépendance à son support des navigateurs