PairBook
A free, no-signup database of correlation, beta, and holdings-overlap analysis for 52,000+ US stock and ETF pairs.
🔗 Visit PairBook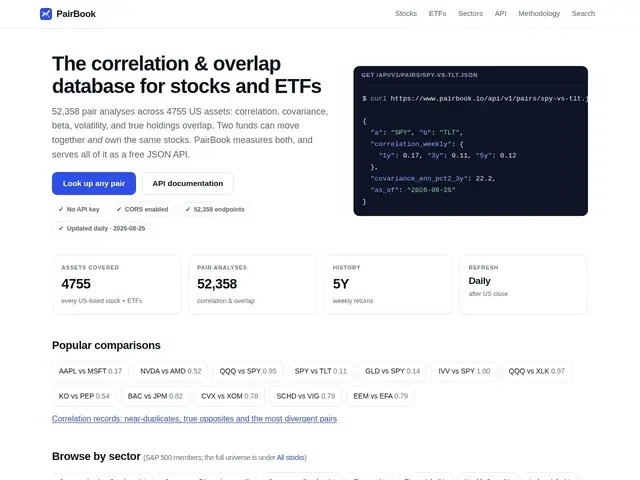
Description
If you own more than a couple of stocks or ETFs, there's a decent chance some of them move together more than you realize — which quietly cancels out the diversification benefit you thought you had. PairBook is a free database that's already run the math: it publishes correlation, covariance, beta, volatility, and holdings-overlap analysis for over 52,000 pairs of US-listed stocks and ETFs, so you can check whether two positions are actually diversifying you or just duplicating the same bet.
Data refreshes daily after market close, covers 1, 3, and 5-year windows, and is exposed through a free public JSON API that needs no API key and allows cross-origin requests — genuinely usable from a browser-side app, not just a backend. There's also an embeddable SVG badge for showing a correlation figure on your own site, and the methodology is documented publicly.
💬 Our review
The short version: a surprisingly generous free resource for a type of analysis that usually sits behind a paid portfolio tool — worth bookmarking if you actively manage a multi-position portfolio.
Tools like Portfolio Visualizer offer similar correlation analysis but behind account walls and more limited free tiers; PairBook's no-signup, no-API-key, CORS-enabled access is unusually open for financial data. The trade-off is scope — it only covers US-listed stocks and ETFs (no international markets, no crypto, no bonds), and as a free service run by what looks like a small team, there's no SLA or guarantee it stays free or maintained indefinitely. Fine as a supplementary check, not a replacement for a full portfolio analytics platform if you need broader asset coverage.
💰 Pricing
📊 Global score
🤖 AI-enriched data
Service et API publique entièrement gratuits, aucune clé requise.
Pros
Plus de 52 000 paires analysées, gratuit, sans inscription ni clé API
Mise à jour quotidienne, fenêtres 1/3/5 ans
API JSON publique CORS activée, utilisable côté navigateur
Méthodologie publique et documentée
Cons
Limité aux actions/ETF cotés aux États-Unis
Aucune garantie de service (SLA), service gratuit sans engagement de pérennité
Pas d'outils au niveau du portefeuille global, seulement par paire