Draxlr
A dashboard tool that plugs straight into your existing database — Supabase, Snowflake, BigQuery, and more — so you can build charts and reports without exporting data anywhere or setting up a data pipeline first.
🔗 Visit Draxlr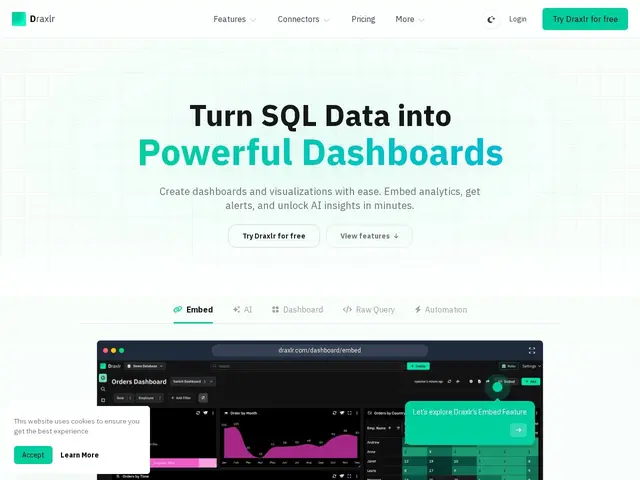
Description
Getting from "we have a database" to "we have a dashboard everyone can check" usually means either building custom reporting code or setting up a data pipeline to copy everything into a separate warehouse. Draxlr skips that step: it connects directly to the database you already have and lets you build dashboards from it in place, no data movement required.
Draxlr is a no-code BI platform connecting to 14+ SQL databases (PostgreSQL, Snowflake, BigQuery, Supabase, Redshift, and others) to build interactive dashboards and visualizations, with AI-powered insights and Model Context Protocol (MCP) integration that lets tools like Claude or Cursor query your data in natural language. It also supports embedded analytics with white-labeling, row-level security, and Slack alerting for teams that want to expose dashboards to customers or push metrics into existing workflows. Pricing runs from a 7-day free trial through Lite ($25/month, one database), Premium ($75), Power ($125), up to custom Enterprise pricing, with an AI-credit system that meters how much of the natural-language querying you can do before needing an add-on.
💬 Our review
The short version: Draxlr's direct-connection, no-ETL approach is a genuine time-saver for small teams on Supabase or Postgres, but the credit-metered AI features and single-database entry tier mean the real cost climbs faster than the $25 headline price suggests.
Compared to Metabase, the dominant open-source and self-hostable alternative, Draxlr trades self-hosting and a one-time cost for a managed SaaS experience with AI-native querying built in — worth it if you want MCP integration with Claude/Cursor without configuring it yourself. Against Looker or Tableau, Draxlr is far cheaper and faster to set up but has a noticeably smaller feature set for complex enterprise reporting. The single-database limit on the entry tier is the sharpest edge: teams with data spread across multiple databases will hit the $75+ tier quickly, and heavy AI-query users will burn through credits and need paid top-ups. Good fit for a startup on one primary database wanting fast dashboards; less so for anyone already running a multi-source data stack.
💰 Pricing
📊 Global score
🤖 AI-enriched data
Essai gratuit 7 jours. Lite 25$/mois (1 base), Premium 75$/mois (2 bases), Power 125$/mois (5 bases), Enterprise 500$+/mois. Crédits IA additionnels 10$/mois par tranche de 200.
Pros
Connexion directe à 14+ bases SQL sans ETL ni duplication
IA native avec intégration MCP pour Claude/Cursor
Analytics embarqués avec marque blanche et sécurité au niveau ligne
Cons
Palier d'entrée limité à une seule base de données
Uniquement SQL, pas de connecteurs CSV/Sheets natifs
Crédits IA vite épuisés pour les gros utilisateurs