Glances
A cross-platform system monitor that shows CPU, memory, disk, network, sensors and container metrics in real time — from the terminal, a web browser, or a REST API.
🔗 Visit Glances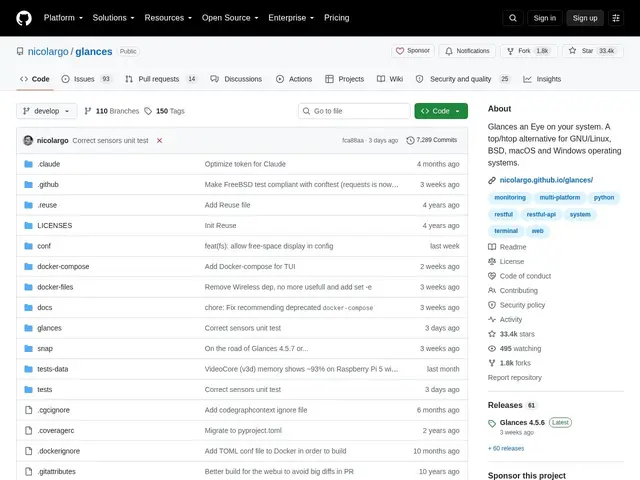
Description
Checking on a server's health often means SSHing in and running several different commands — one for CPU, another for memory, another for disk. Glances puts all of that on one screen at once, updating live, and unlike most terminal monitors, it can also serve that same view as a web page or a REST API, so you're not limited to being physically in a terminal to check on a machine.
Glances monitors CPU, memory, disk, network, temperature and voltage sensors, and Docker/LXC/Podman containers, with interface options including a terminal UI, web UI, CLI mode, and REST API for remote or programmatic access. It can export metrics to InfluxDB, PostgreSQL, Prometheus, Kafka, RabbitMQ, NATS and more, and recent versions add an MCP server mode for AI-assistant integration. It's free and open source under LGPL v3, written in Python, cross-platform (Linux, BSD, macOS, Windows, Android via Termux), with 33.4k GitHub stars.
💬 Our review
The short version: glances replaces the habit of running top, then df, then a separate network tool, with one live dashboard that also happens to work as a web page or an API if you need to check on a machine remotely.
Against htop or top, glances covers far more ground — disk, network, sensors, containers — in one view, at the cost of being a heavier Python-based tool rather than a minimal C process viewer. Against btop, which focuses on a highly polished terminal-only UI, glances trades some visual flair for reach: a REST API and web UI mean you can monitor a fleet of machines without SSH access to each one, and the database export options (Prometheus, InfluxDB) make it usable as an actual monitoring pipeline component, not just a one-off terminal tool. It does require Python 3.10+, which can be a blocker on older systems. For anyone who wants one tool that scales from 'quick terminal check' to 'exported metrics feeding a dashboard,' it's hard to match for free.
💰 Pricing
📊 Global score
🤖 AI-enriched data
Projet open source (licence LGPL v3), aucune offre payante
Pros
Vue unique combinant CPU, mémoire, disque, réseau, capteurs et conteneurs
Trois modes d'accès : terminal, interface web, API REST
Export vers InfluxDB, Prometheus, PostgreSQL et autres
Support natif Docker/LXC/Podman
33 400+ étoiles, communauté large et active
Cons
Nécessite Python 3.10+, absent sur certains systèmes anciens
Peut devenir gourmand en ressources avec l'export actif
Configuration plus complexe pour les fonctionnalités avancées