ctop
A terminal dashboard that shows Docker and runC containers' live CPU, memory and network metrics in a top-like grid, letting you zoom into any container for logs and a shell.
🔗 Visit ctop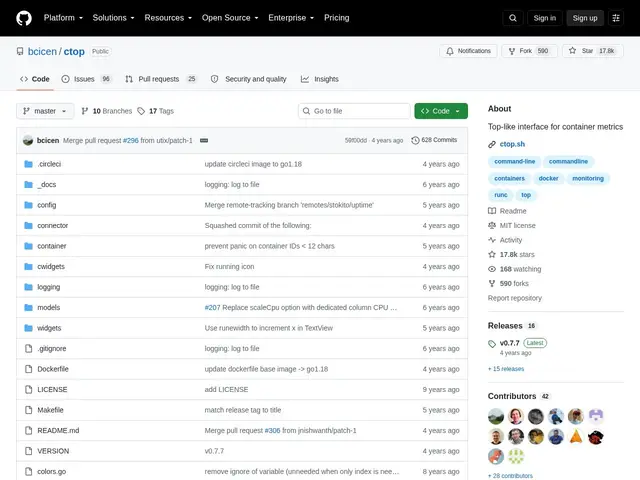
Description
If you've ever run 'docker stats' and squinted at a scrolling wall of numbers, ctop is the fix: it's a small terminal program that turns your running containers into a live dashboard, similar to how the 'top' command shows your computer's busiest processes — except here every row is a Docker (or runC) container, color-coded and updating in real time.
ctop presents a grid view of all containers with CPU, memory, network and disk I/O, and lets you drill into any single container for a detailed view, live logs, or a direct shell — all from a lightweight terminal UI with no GUI dependency. It supports interactive filtering and sorting, configurable columns, and multiple keybinding sets, and runs cross-platform (Linux, macOS, Windows, and inside Docker itself). It's open source and free, with 17.8k GitHub stars.
💬 Our review
The short version: if you manage more than a couple of containers and are tired of re-running 'docker stats' or opening a separate terminal per container, ctop gives you one live screen with metrics, logs and shell access for all of them.
Compared to raw 'docker stats', ctop adds sorting, filtering, and the ability to jump straight into a container's logs or shell without leaving the tool — a real workflow improvement for anyone doing manual container triage. Against a heavier GUI option like Portainer, ctop trades a web dashboard and remote management for something that starts instantly over SSH with zero setup, which matters when you're debugging a production host and don't have a browser open to it. Its main weakness is pace of development — the last commit dates to mid-2024, so while it's stable and widely used (17.8k stars), don't expect new features. For quick terminal-based visibility into container health, it remains one of the simplest tools available and costs nothing to try.
💰 Pricing
📊 Global score
🤖 AI-enriched data
Projet open source, aucune offre payante
Pros
Vue grille en temps réel de tous les conteneurs
Accès direct aux logs et au shell d'un conteneur
Interface terminal légère, sans dépendance GUI
Multiplateforme (Linux, macOS, Windows, Docker)
17 800+ étoiles GitHub, largement adopté
Cons
Rythme de développement ralenti (dernier commit mi-2024)
Version encore sous 1.0 (v0.7.7)
Limité aux métriques de conteneurs, pas une supervision d'infra complète