witr
A free command-line tool that answers "what started this?" for any process, open port, running container or locked file, with a clear chain instead of scattered log digging.
🔗 Visit witr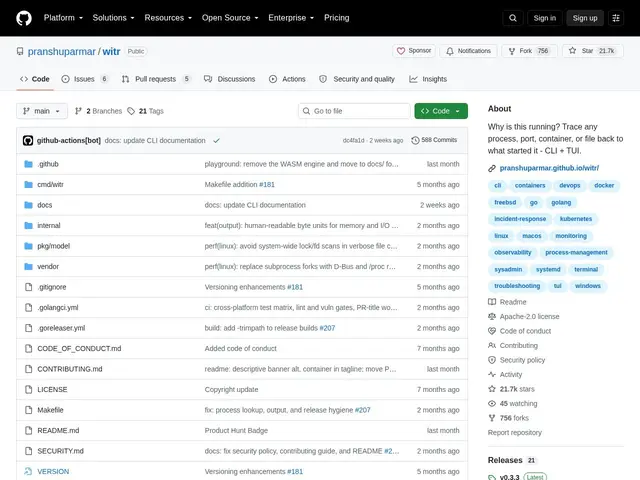
Description
When something's misbehaving on a server — a mystery process eating CPU, a port that shouldn't be open, a file that won't unlock — the usual fix is stitching together output from several different tools like `ps`, `lsof` and `netstat` by hand to figure out what actually started it. witr is a single command-line and terminal-UI tool built to answer that one question directly: given a process, port, container or file, it traces the exact chain of what launched it, so you don't have to reconstruct the story yourself.
witr supports tracing by PID or process name, port monitoring, container inspection and file-lock/path analysis, all through an interactive terminal UI with four tabs (processes, ports, containers, file locks), or as scriptable JSON, tree-view or narrative-style output. It has mouse support in the terminal UI and runs cross-platform on Linux, macOS, Windows and FreeBSD. Written in Go, it's free and open source with 21.7k GitHub stars, 756 forks and 588 commits on main, and is installable through 15+ package managers — a sign of real production adoption rather than a weekend project.
💬 Our review
The short version: if you're tired of manually cross-referencing `ps`, `lsof`, `netstat` and `strace` output to figure out what actually started a rogue process, container or open port, witr does that correlation for you in one command, and it's free.
What makes witr worth a look over its older Unix counterparts isn't new functionality so much as consolidation and presentation: instead of running three separate tools and mentally stitching the output together, you get one interactive TUI with tabs for processes, ports, containers and file locks, plus JSON output for scripting into your own tooling. With 21.7k GitHub stars, hundreds of forks and steady commit activity, it's clearly seen real adoption rather than being an abandoned side project, and availability through 15+ package managers means installing it is rarely friction. The honest caveat is that it's a specialist's tool — if you're not regularly debugging process/port/container ownership issues, you won't need it, and full tracing capability may require elevated privileges depending on your OS. Genuinely useful for sysadmins, SREs, DevOps engineers and incident responders; less relevant for typical application developers who rarely touch process-level debugging.
💰 Pricing
📊 Global score
🤖 AI-enriched data
Projet open source (Go), installable via 15+ gestionnaires de paquets, aucune offre payante
Pros
21.7k étoiles GitHub, adoption réelle et communauté active
Consolide en un seul outil ce que lsof/netstat/strace font séparément
TUI interactive avec support souris, 4 onglets (processus, ports, containers, verrous fichiers)
Sortie scriptable en JSON, vue arborescente ou narrative
Multi-plateforme (Linux, macOS, Windows, FreeBSD), installable via 15+ gestionnaires de paquets
Cons
Outil de niche, utile surtout pour le debugging système/ops
Peut nécessiter des privilèges élevés pour un traçage complet des processus