Markdy
An open-source DSL that turns text descriptions into animated, CI-lintable architecture diagrams.
🔗 Visit Markdy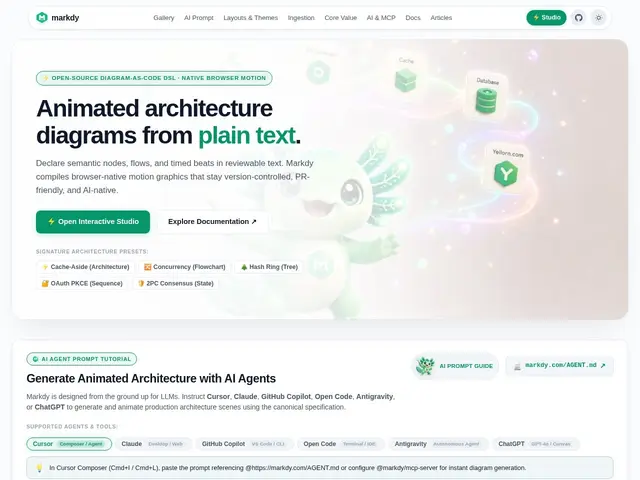
Description
Explaining how a system is built — which services talk to which, how a request flows through it — is usually done with a diagram someone drew by hand in a tool like Draw.io, which then goes stale the moment the architecture changes. Markdy takes a different approach: you describe the diagram in text, and it renders and even animates it for you, the same way code gets compiled into a running program.
Markdy is an open-source, MIT-licensed DSL (domain-specific language) for turning written descriptions of a system into animated architecture diagrams, supporting 17 diagram types including flowcharts, sequence diagrams, state machines, Gantt charts, and layered architecture views. Because it works from text, it can also ingest and convert existing formats — Mermaid, Docker Compose files, Kubernetes YAML, Terraform, and Draw.io — so you're not always starting from scratch. Diagrams render in the browser using the Web Animations API rather than Canvas or WebGL, come in eight visual themes (paper, terminal, blueprint, midnight, and more), and can be linted in CI/CD to catch broken or out-of-date diagrams before they ship. It also runs an MCP server, letting AI coding agents like Claude or Cursor generate and update diagrams directly. It's free to use.
💬 Our review
The short version: if your team documents architecture as diagrams that constantly drift out of sync with reality, Markdy's text-first, CI-lintable approach treats diagrams more like code than like static images — and that's the whole point of diagrams-as-code tools.
Its direct competitor is Mermaid, which pioneered text-to-diagram rendering and has far broader adoption (built into GitHub, GitLab, and most docs tools already); Markdy's edge is animation, a wider set of 17 layout types, and native ingestion of Mermaid/Terraform/Kubernetes/Compose files so migrating existing diagrams isn't a rewrite. Against a manual tool like Draw.io or Lucidchart, you trade drag-and-drop visual polish for versionable, diffable, CI-checkable source files — a clear win for engineering teams, a clear loss for anyone who wants pixel-perfect manual control over layout. Being free and open source removes the cost objection entirely; the real question is whether your team is disciplined enough to keep diagram source files updated alongside the code they describe, which is true of every diagrams-as-code tool, not just this one.
💰 Pricing
📊 Global score
🤖 AI-enriched data
MIT, aucun coût
Pros
17 types de diagrammes, y compris animés
Ingestion directe de Mermaid, Terraform, Kubernetes YAML, Docker Compose, Draw.io
Lint en CI/CD pour éviter les diagrammes obsolètes
Serveur MCP pour agents IA de code
Cons
Adoption et écosystème bien plus restreints que Mermaid
Pas de contrôle visuel manuel fin comme un outil de dessin classique
Nécessite une discipline d'équipe pour garder les sources à jour