Uptrace
A tool that shows engineers exactly which part of their app is slow or broken, by collecting traces, metrics and logs from the code in one place — built on the free, open OpenTelemetry standard instead of a proprietary agent.
🔗 Visit Uptrace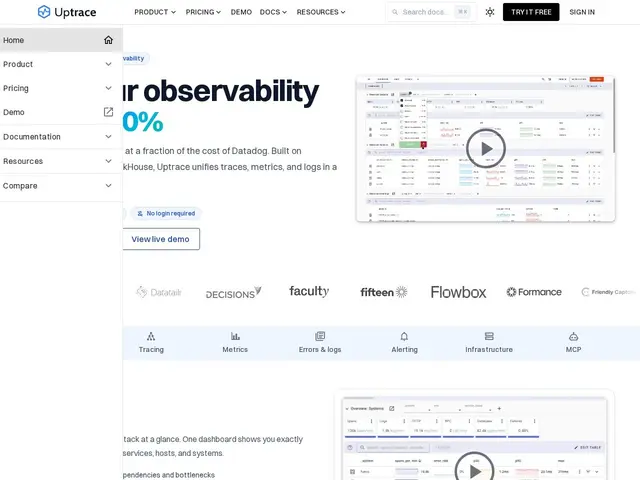
Description
When something goes wrong in production, the hard part usually isn't knowing that it broke, it's finding out which of a dozen services caused it. Uptrace is built to answer that question fast, by pulling in traces (the path a request takes through your system), metrics (numbers like error rate and latency), and logs into a single view.
Uptrace is an OpenTelemetry-native observability platform built on ClickHouse, aimed at processing high volumes of spans more cheaply than closed competitors. It draws a service graph showing dependencies and bottlenecks, tracks RED metrics (request rate, error rate, latency) and latency percentiles (p50/p90/p99/max), surfaces top errors and log pattern analysis, and supports zero-code instrumentation with SAML/OIDC single sign-on. It ships both as a paid cloud service and as a free, unlimited self-hosted Community Edition.
💬 Our review
The short version: Uptrace's real selling point isn't a feature list — Datadog and New Relic have deeper feature sets — it's that it's built entirely on OpenTelemetry, the open standard, so you're not locked into a proprietary agent, and there's a genuinely free, unlimited self-hosted edition if you want to skip the bill entirely.
On the cloud side, pricing starts generous (50GB/month free) and scales per-GB with volume discounts down to $0.016/GB, which is meaningfully cheaper than Datadog at scale — but Datadog and New Relic still win on breadth of integrations, alerting sophistication, and enterprise support if budget isn't the constraint. For a team that already has OpenTelemetry instrumentation (or is willing to add it) and wants either a cheaper managed option or full control via self-hosting, Uptrace is a strong, low-risk pick; for a team wanting an all-in-one platform with the most mature ecosystem regardless of cost, Datadog remains the safer default.
💰 Pricing
📊 Global score
🤖 AI-enriched data
Cloud : gratuit jusqu'à 50 Go/mois puis 0,075 $/Go (remises volume jusqu'à 0,016 $/Go) ; métriques 0,025 $/million de points ; stockage froid 0,01 $/Go/mois. Édition Community auto-hébergée : gratuite, sans limite.
Pros
100% basé sur OpenTelemetry — zéro verrouillage propriétaire, migration facile
Édition self-hosted gratuite et illimitée pour toujours (Community Edition)
Tarification cloud nettement plus agressive que Datadog à volume élevé
Graphe de services, métriques RED et percentiles de latence intégrés
Cons
Écosystème d'intégrations et de fonctionnalités d'alerting moins mature que Datadog ou New Relic
Nécessite une instrumentation OpenTelemetry déjà en place ou à mettre en œuvre
Auto-hébergement exige de gérer soi-même ClickHouse en production