XY
A free Python charting library built to stay smooth even when you're plotting hundreds of millions of data points — something libraries like Matplotlib or Plotly tend to choke on.
🔗 Visit XY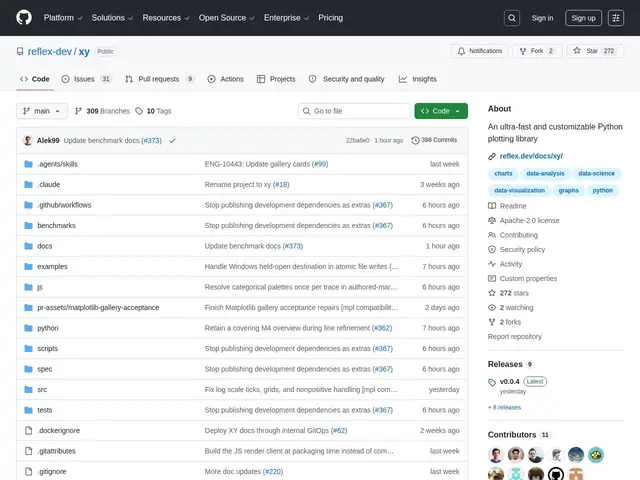
Description
Plotting a few thousand data points in Python is easy with any charting library; plotting tens of millions and still being able to pan and zoom smoothly is a much harder problem most tools weren't built for. XY, from the team behind the Reflex web framework, tackles this with a Rust core: instead of drawing a marker for every single row above ~200,000 points, it computes a screen-bounded density surface — essentially drawing only the detail your screen can actually show — which keeps rendering at roughly 0.07-0.08 seconds whether you have 10,000 or 100 million points.
It's positioned as a drop-in-style replacement for Matplotlib, Plotly, and Bokeh, with a Matplotlib-compatible pyplot adapter to ease migration, full styling via Python, CSS, or Tailwind, and export to HTML, PNG, SVG, or PDF. It integrates natively with the Reflex web framework but works standalone in notebooks and scripts too. It's currently pre-1.0 and in active alpha development, so its API — callback payloads, the Reflex adapter, chart breadth — is still expected to change.
💬 Our review
The short version: if you've ever had a Python chart freeze or take forever to render because your dataset was too big, XY is specifically built to fix that — its whole reason to exist is staying fast at a scale where Matplotlib and Plotly typically slow to a crawl.
Being free, open source (Apache 2.0), and backed by an active team (Reflex) gives it real credibility despite being pre-1.0, but that alpha status is a genuine caveat — the API can and likely will change before a stable 1.0, so it's a better fit for a new project or an internal tool than for something you need rock-solid today. For teams already on Reflex for their web app, the native integration is a clear win; for a one-off notebook analysis, a mature library like Plotly remains the safer, more documented choice for now.
💰 Pricing
📊 Global score
🤖 AI-enriched data
Entièrement gratuit, licence Apache 2.0, installable via pip.
Pros
Reste fluide jusqu'à des centaines de millions de points (cœur Rust)
Gratuit, open source, adaptateur de compatibilité Matplotlib
Style personnalisable via Python, CSS ou Tailwind
Cons
Pré-1.0 : API encore instable, changements probables
Écosystème et documentation moins matures que Matplotlib/Plotly
Intégration la plus poussée réservée aux utilisateurs de Reflex