Embedful
A tool that turns spreadsheets and analytics data into charts and dashboards you can drop straight onto your website or into Notion, without hiring a data team.
🔗 Visit Embedful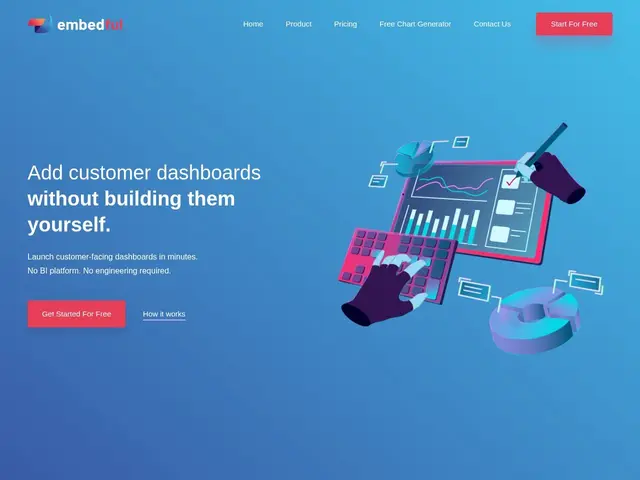
Description
If you've ever wanted to show clients or website visitors a live chart — sales this month, sign-ups this week — without paying for a full business-intelligence platform or asking an engineer to build it, that's the gap Embedful fills. You connect a data source, pick a chart or counter, and get an embed code you can paste almost anywhere: your website, a client portal, or a Notion page.
Embedful connects to Google Analytics, Google Sheets, CSV/Excel files, and custom APIs, then generates charts, tables, and counters with automatic update scheduling and responsive layouts. Output can be shared as an embedded link, a website embed, or through a client portal with public or private access, and it plugs directly into WordPress, Notion, Framer, Coda, Drupal, and Wix. It's aimed at teams that need client-facing or public analytics without building custom dashboards or licensing a full BI suite.
💬 Our review
The short version: if you need a simple, presentable chart or dashboard embedded on a website or in Notion — and don't want to touch a full BI tool — Embedful gets you there fast with minimal setup.
The tradeoff is scope: this is a lightweight embedding tool, not a full analytics platform, so if you need complex joins across multiple databases, custom SQL, or deep drill-down analysis, tools like Metabase or Looker Studio will serve you better. Compared to Databox, which leans more toward internal team dashboards and KPI tracking, Embedful's focus on embeddability — website, Notion, client portals — is its clearest differentiator; compared to Chartbrew, which is closer in spirit (also lightweight, also embed-focused), the decision likely comes down to which data connectors and platform integrations match what you already use. It's worth it specifically for agencies and small teams that need to hand clients a live number or chart without building custom infrastructure — overkill if you already have proper BI tooling in place.
📊 Global score
🤖 AI-enriched data
Inscription gratuite disponible ; grille tarifaire complète non détaillée sur la page d'accueil.
Pros
Connecteurs simples : Google Analytics, Google Sheets, CSV/Excel, API
Embed direct dans WordPress, Notion, Framer, Coda, Drupal, Wix
Mise en place rapide sans compétence BI
Portails clients avec accès public ou privé
Cons
Pas conçu pour des analyses complexes multi-sources ou du SQL avancé
Grille tarifaire peu transparente sur le site