Apitally
A privacy-focused API monitoring tool that shows you request metrics, errors, and traces for your backend with a few lines of setup, across 23+ frameworks in Python, Node.js, Go, C# and Java.
🔗 Visit Apitally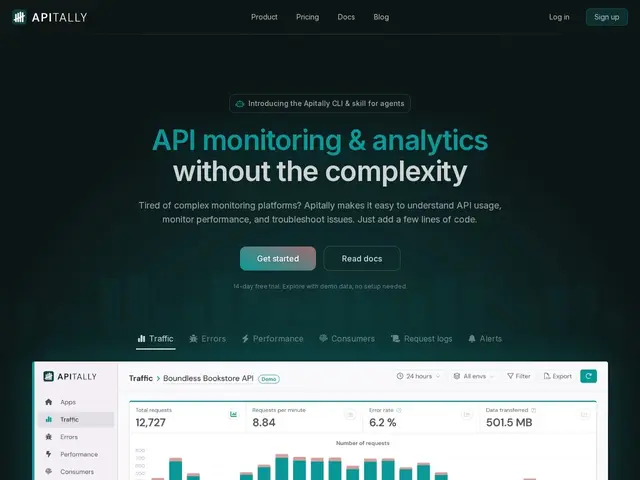
Description
Once an API is in production, you need to know when it's slow, when it's erroring, and who's hammering it — but full observability platforms are often overkill, expensive, and collect far more data than you're comfortable sending to a third party. Apitally is built as the lighter, more privacy-conscious middle ground: you add a small integration to your existing framework (FastAPI, Django, Express, Spring Boot, and 20 others are supported), and it gives you request metrics, logs, traces, and configurable alerts without vacuuming up sensitive payload data by default.
It minimizes what it collects out of the box and gives you explicit controls to mask or exclude sensitive fields, which is the core of its privacy pitch versus a general-purpose observability suite. It ships a mobile-friendly dashboard, sends alerts to Slack or Microsoft Teams, and even supports Cloudflare Workers via Logpush for edge deployments. Metrics and analytics processing is unlimited regardless of plan, but request log storage is capped by tier — the entry Basic plan includes 1M logs/month for a single app and user, scaling up through Starter and Premium tiers as your team and traffic grow. Every plan includes a 14-day free trial with no credit card required, though there's no permanent free tier after that.
💬 Our review
The short version: Apitally hits a real gap between "no monitoring at all" and "pay for a full Datadog-style observability suite you don't need" — the setup is genuinely light, the privacy-by-default posture is a legitimate differentiator, and the pricing scales in a way that's readable up front, unlike most enterprise observability vendors.
Against Datadog or New Relic, Apitally deliberately does far less — no infrastructure monitoring, no APM across your whole stack, just API-focused metrics, logs, traces and alerts — which is exactly the point for a team that finds those platforms bloated and pricey for what they actually need. Against Sentry, which focuses primarily on error tracking, Apitally leans more into ongoing request-level metrics and performance rather than just capturing exceptions. Against self-hosted Prometheus, Apitally trades infrastructure control for zero-setup convenience and a hosted dashboard, at a real monthly cost starting at $29. The one thing to watch is the request-log cap per tier — teams with high-volume APIs should model their expected log volume against the tier limits before committing, since scaling from Basic to Starter to Premium adds up quickly if you're log-heavy rather than just metrics-heavy.
💰 Pricing
📊 Global score
🤖 AI-enriched data
Essai gratuit 14 jours sans CB. Basic 29$/mois (1 app, 1 utilisateur, 1M logs/mois), Starter 99$/mois, Premium 299$/mois. Métriques illimitées sur tous les paliers, logs plafonnés selon le tier.
Pros
Support de 23+ frameworks (FastAPI, Django, Express, Spring Boot, etc.)
Approche privacy-first : minimise la collecte par défaut, contrôles de masquage
Tarification lisible dès 29$/mois, essai 14 jours sans CB
Cons
Logs de requêtes plafonnés par palier (1M/mois sur le plan Basic)
Plan Basic limité à 1 app et 1 utilisateur, montée en gamme rapide
Aucun palier gratuit permanent après l'essai