ServiceRadar
A free, open-source tool for watching over network infrastructure spread across remote or hard-to-reach sites — think branch offices, edge locations or restricted networks — where you can't just install a normal monitoring agent everywhere.
🔗 Visit ServiceRadar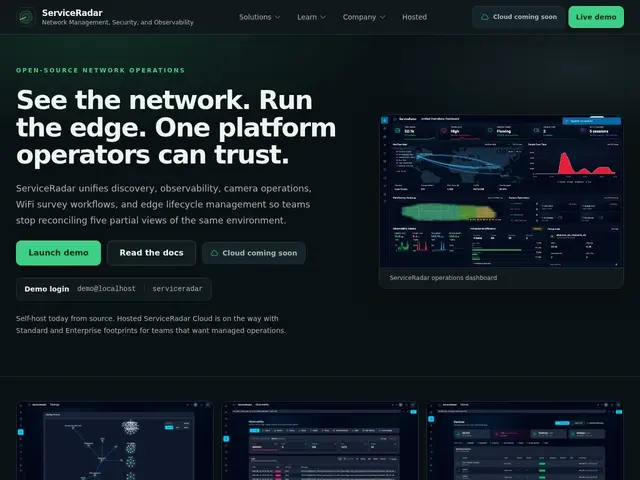
Description
Standard monitoring tools usually assume your servers all live in one reachable network with wide-open access to a central dashboard. That assumption breaks down for companies with lots of small remote sites, air-gapped or segmented networks, or edge hardware — which is exactly the gap ServiceRadar is built to fill, discovering and monitoring services and devices even in constrained, change-controlled environments without needing broad access into the core network.
It's a fully open-source (Apache 2.0) platform combining network discovery and inventory, NetFlow analytics, edge telemetry, endpoint software tracking, and even the ability to run Ansible/AWX automation against the systems it monitors. Under the hood it speaks a long list of observability protocols (OTEL, GELF, Syslog, SNMP, BGP, NetFlow), maps network topology in a GPU-accelerated real-time engine that can render millions of nodes, includes a WASM plugin system for writing custom checks in Go or Rust, and uses a "causal engine" to help pinpoint root causes and isolate the blast radius of an incident quickly. It's built on a modern stack (Go agents, Elixir/Phoenix backend, TimescaleDB, NATS JetStream) and a hosted cloud version is coming, alongside the always-free self-hosted option.
💬 Our review
The short version: if your monitoring headache is specifically about remote, segmented or edge networks that regular tools can't reach — not general-purpose app/server monitoring — ServiceRadar is a purpose-built, free option worth trying before reaching for something heavier.
For general infrastructure monitoring, tools like Datadog or Grafana-based stacks are more mature and broadly used, but ServiceRadar's specific angle — zero-trust discovery in constrained networks, NetFlow analytics, and a WASM plugin system for custom checks — targets a narrower, real pain point that those generalist tools don't optimize for. Being fully open source and Apache 2.0 licensed means there's no license cost at all for the self-hosted version, which is a meaningful advantage over commercial network-monitoring suites that charge per device or per data volume; the tradeoff, as with any self-hosted observability stack, is that you're running the Go/Elixir/TimescaleDB/NATS stack yourself until the hosted cloud tier ships. Worth evaluating specifically if you manage infrastructure across many remote or restricted sites.
💰 Pricing
📊 Global score
🤖 AI-enriched data
Auto-hébergé gratuit (Apache 2.0). Version cloud hébergée annoncée (Standard et Enterprise), tarifs pas encore publiés.
Pros
100% open source (Apache 2.0), gratuit en auto-hébergement
Conçu spécifiquement pour réseaux distants/segmentés/edge
Supporte de nombreux protocoles (OTEL, SNMP, NetFlow, BGP, Syslog)
Système de plugins WASM pour checks personnalisés en Go/Rust
Cons
Version cloud hébergée pas encore disponible ("coming soon")
Niche spécifique (réseaux distants) plutôt que monitoring généraliste
Nécessite de gérer soi-même une stack Go/Elixir/TimescaleDB/NATS