Count
A collaborative data exploration canvas where a data team, a product manager, and a business stakeholder can all work on the same analysis together, in SQL, Python, or plain-English chat with AI models built in.
🔗 Visit Count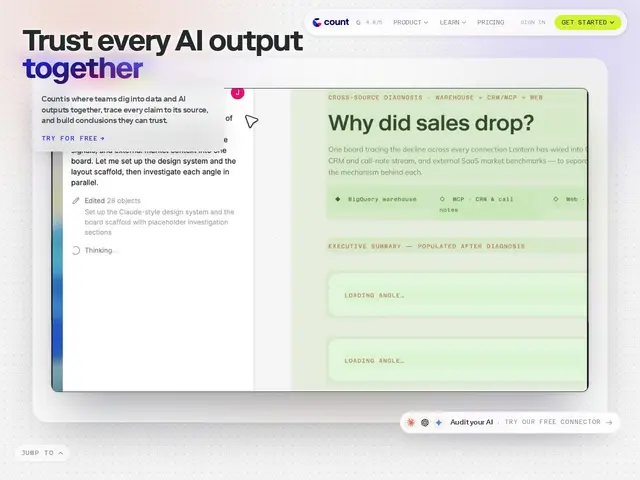
Description
Data analysis often turns into a game of telephone: a business person asks a question in Slack, an analyst writes a query, exports a screenshot, and by the time it comes back the original question has drifted. Count is built around a shared 'canvas' where the whole conversation stays in one place — an analyst can write SQL or Python, a less technical teammate can ask a question in plain English through an AI agent, and everyone sees the same live results instead of a static screenshot.
It plugs in AI agents from Anthropic, OpenAI, and Google directly into the exploration workflow, so questions posed in natural language can turn into real queries against your actual data rather than a generic chatbot answer. It's positioned as a companion to your existing BI stack rather than a replacement — the goal is faster, more collaborative ad-hoc exploration, not necessarily governed executive dashboards. Pricing starts free (3 editors, 3 canvases), moves to $49/editor/month Pro, $69/editor/month Scale (15-seat minimum), and custom Enterprise for larger deployments needing HIPAA compliance, SSO, and row-level security.
💬 Our review
The short version: Count is worth trying specifically for the collaboration angle — if your team's real bottleneck is the back-and-forth between analysts and non-technical stakeholders rather than a lack of dashboards, this targets that gap more directly than a traditional BI tool.
Against Hex or Metabase, which are also SQL/notebook-style exploration tools, Count's differentiator is the shared canvas model plus native multi-provider AI agent integration (not locked to one AI vendor), letting non-technical users participate directly instead of just viewing finished dashboards. Against full BI platforms like Omni or Databox, Count is explicitly positioned as a companion for exploration rather than a governed reporting system, so it doesn't replace your dashboard layer — you'll likely run both. The free tier (3 editors, 3 canvases) is a genuinely useful way to test whether the collaborative format fits your team's workflow before the $49-69/editor/month cost kicks in. <!-- ai-generated -->
💰 Pricing
📊 Global score
🤖 AI-enriched data
Gratuit (3 éditeurs) puis 49$/éditeur/mois (Pro) ou 69$/éditeur/mois (Scale, min 15 sièges) ; Enterprise sur devis
Pros
Canvas partagé data + non-technique
Agents IA multi-fournisseurs
Vrai tier gratuit pour tester
Cons
Scale exige 15 sièges minimum
Complément et non remplaçant d'une BI
Coût par éditeur peut grimper vite