Szum
Write one JSON description of a chart and get the same chart, styled consistently, in your app, in Figma, and in a Slack message — no re-styling required.
🔗 Visit Szum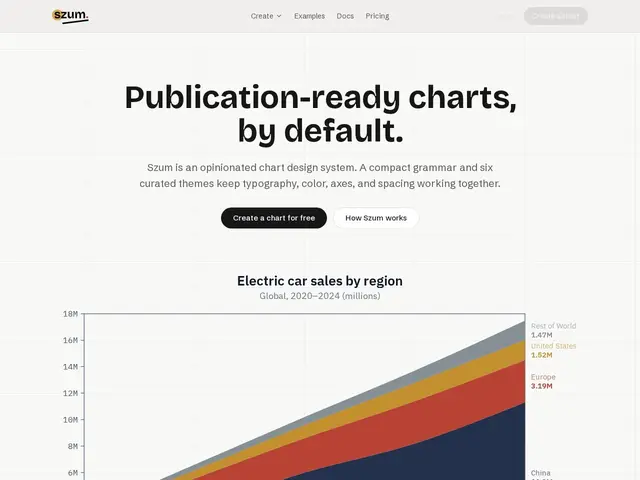
Description
Charts made in a design tool almost never match the ones a developer eventually ships in the product — colors drift, fonts change, spacing is off, and someone ends up manually redoing the chart at least once. Szum's fix is to make both come from the exact same small text description: write it once, and get a matching chart whether it's rendered in your app, dropped into a Figma mockup, or embedded in a Slack message.
The JSON definition covers marks (bar, line, dot, area, and combinations of them), data, scales, labels and theme, and is compact enough for a human or an AI agent to write directly. It ships with a web editor, a Figma plugin, an API/SDK, an MCP server for AI-agent integration, and six curated themes. Pricing is render-based: Free (5,000 renders/month, with a keyless option at 250/month per IP), Creator at $9/month (20,000 renders, custom themes), Pro at $29/month (100,000 renders, priority support), and custom Enterprise pricing, with roughly 20% off on annual billing.
💬 Our review
The short version: Szum's single-definition-everywhere idea directly solves a real, specific annoyance — design and production charts drifting apart — and the Figma-plus-code combo is something general charting libraries like Chart.js or D3 simply don't offer out of the box.
Against Chart.js, D3.js or Recharts, which are code-only charting libraries with no native design-tool integration, Szum's differentiator is the Figma plugin sharing the same config as the production render — a genuinely different value proposition, not just another styling layer. Against Observable Plot, which is more of a flexible grammar-of-graphics library for data exploration, Szum is narrower but more opinionated and easier to keep visually consistent across a team. The free tier's 5,000 renders/month is generous for prototyping, but the render-based (not view-based) billing model means heavy dynamic-chart usage could get expensive faster than a flat-rate library. Worth adopting for teams that maintain the same charts across a design file and a shipped product; overkill if you just need a one-off chart in a single codebase.
📊 Global score
🤖 AI-enriched data
Gratuit : 5 000 rendus/mois (option sans clé : 250/mois par IP). Creator $9/mois (20 000 rendus). Pro $29/mois (100 000 rendus). Enterprise sur devis. ~-20% en facturation annuelle.
Pros
Une seule définition JSON pour app, Figma, Slack, Notion, email
Plugin Figma partageant la config avec la production
Compatible agents IA (définition compacte, serveur MCP)
6 thèmes soignés inclus
Cons
Facturation au rendu peut coûter cher en usage dynamique intensif
Plus rigide qu'une librairie de charting générique (D3, Chart.js)
Produit jeune, écosystème encore restreint