Microcharts
A free React library for making tiny, lightweight charts — small enough to sit inside a sentence or a table cell — with zero extra dependencies.
🔗 Visit Microcharts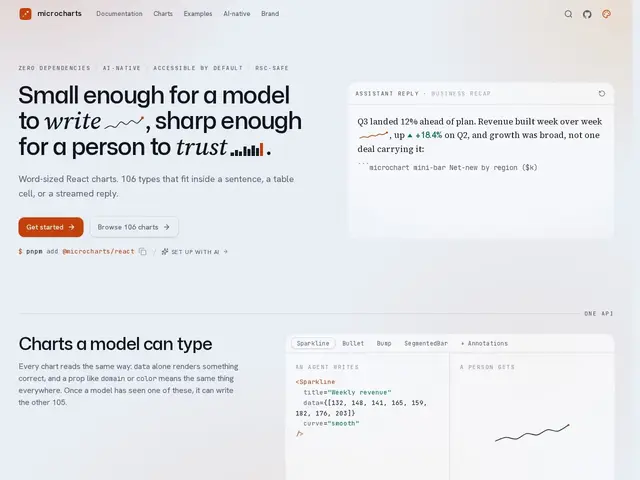
Description
Most charting libraries are built for big dashboards: they're heavy, need a large chunk of your page's loading budget, and look out of place squeezed into a small space like a table cell or a line of AI-generated text. Microcharts takes the opposite approach — tiny, simple charts (sparklines, bar charts, heatmaps, and more) designed to be dropped anywhere text can go, without dragging in a large dependency tree.
It's a free, open-source (MIT) React library with 106 different chart types, each between 2.17 and 6.75 kB, zero runtime dependencies, and accessible-by-default rendering with auto-generated descriptions for screen readers. It's compatible with React Server Components and reports native adoption inside Claude, ChatGPT, and Gemini's chart-rendering surfaces, plus a colorblind-safe default palette.
💬 Our review
The short version: if you need small, inline data visuals in a React app — not a full dashboard — Microcharts is free, tiny, and easy to justify adding to your bundle.
Against Recharts, Victory, and Chart.js, all of which are built primarily for full-size dashboard charts and pull in meaningfully more bundle weight, Microcharts occupies a different niche entirely: compact, inline visuals meant to live inside text, table cells, or chat responses. It's not a replacement for those libraries if you're building a full analytics dashboard — it's a complement for the smaller visual moments those libraries are overkill for. The obvious limit is that it's React-only, so Vue, Svelte, or vanilla JS projects can't use it directly, and its charts are intentionally too compact for dense multi-series dashboards.
📊 Global score
🤖 AI-enriched data
Libre et open source (licence MIT), installable via npm.
Pros
106 types de graphiques
Zéro dépendance, bundle ultra-léger
Accessible par défaut
Intégré dans Claude/ChatGPT/Gemini
Compatible React Server Components
Cons
Limité à React
Visuels très compacts
Courbe d'apprentissage pour non-familiers de React