Coroot
A free, open-source tool that watches your Kubernetes cluster and tells you what broke and why, without adding any code to your apps.
🔗 Visit Coroot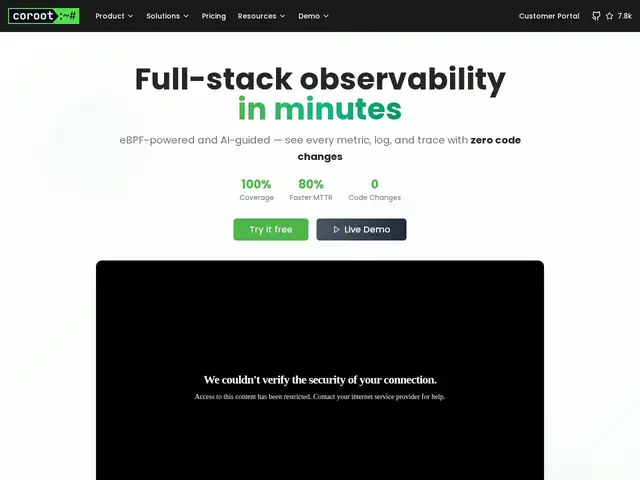
Description
Figuring out why a service is slow or down in Kubernetes usually means digging through logs, dashboards, and traces scattered across different tools — and by the time you've found the cause, the incident's already cost you. Coroot takes a different approach: it watches your cluster from the outside using a Linux kernel technology called eBPF, so it can see network calls, errors, and slowdowns without you touching a single line of application code, and its AI layer tries to point you straight at the root cause.
Coroot is an open-source (Apache 2.0) observability and APM platform combining metrics, logs, distributed tracing, and continuous profiling in one dashboard, plus AI-powered root cause analysis and SLO-based alerting. It works with EKS, AKS, GKE, OpenShift, and OKE, claims a 2-minute setup with zero code instrumentation, and stores logs in ClickHouse with roughly 10x compression. The free Community Edition (7.8k GitHub stars, 25M+ downloads) is fully self-hostable; the Enterprise tier adds advanced features for $1 per monitored CPU core/month. Users include Walmart, Comcast, and Safaricom.
💬 Our review
The short version: for teams running Kubernetes who want real observability without the multi-tool sprawl (or the Datadog bill), Coroot's free, self-hosted Community Edition is one of the more compelling open-source options available right now.
Its main edge over Prometheus+Grafana DIY setups is that eBPF-based zero-instrumentation approach — you don't have to add SDKs to every service, which is a real time save for large or legacy clusters. Compared to Datadog or New Relic, Coroot is dramatically cheaper (free self-hosted, or $1/core/month for the enterprise tier vs Datadog's per-host-per-month pricing that adds up fast), at the cost of a smaller ecosystem, fewer integrations, and a community that's still growing relative to Prometheus/Grafana. Metoro is the closer comparison — both use eBPF and AI root-cause analysis for Kubernetes — but Coroot's free self-hosted tier makes it the pick for teams that want to own their infrastructure and avoid a recurring SaaS bill, while Metoro leans more toward a managed, hands-off experience.
📊 Global score
🤖 AI-enriched data
Community Edition : gratuit, open-source (Apache 2.0), self-hosted. Enterprise : $1 par cœur CPU surveillé/mois.
Pros
Zéro instrumentation grâce à eBPF
Metrics+logs+traces+profiling unifiés
Edition Community 100% gratuite et open-source
Tarif enterprise très bas ($1/cœur/mois)
Cons
Centré Kubernetes, moins adapté aux VM/bare-metal
Écosystème plus petit que Prometheus/Grafana
Fonctions avancées réservées à la version payante