Autoplot
A Mac app for turning spreadsheets of numbers into publication-ready charts and figures — built for researchers and students who currently juggle a spreadsheet, a plotting script, and a separate export step just to get one clean graph for a paper.
🔗 Visit Autoplot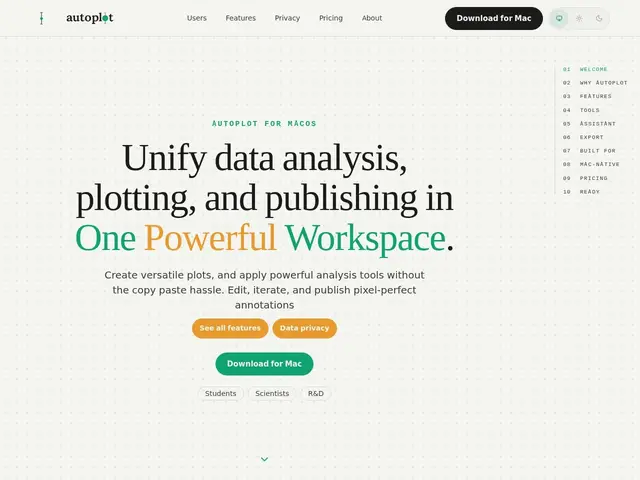
Description
Making a proper scientific figure usually means bouncing between tools: a spreadsheet or CSV for the raw data, a script in Python or R for the actual plotting logic, and then manual cleanup to get something publication-quality. Autoplot's goal is to collapse that into one native Mac workspace where importing, analyzing, and exporting a figure all happen in the same place.
It supports a wide range of plot types (2D, 3D, heat maps, histograms, categorical charts) and built-in analysis tools like power-law fits, CCDF, finite-size scaling, and correlation matrices, plus an AI assistant that can write and run the Python needed for a custom analysis you describe in plain language. Figures support in-figure annotation that persists across edits, and export to vector PDF, PNG, or JPG at journal-ready specifications. Metal-backed GPU rendering keeps large 3D scenes and correlation networks responsive even at full dataset size, and it works with local files or SFTP import, with automatic merging. It's local-first with offline capability, which matters for data-privacy-sensitive research. Pricing is Free ($0, 10 hosted-AI credits/month), Plus ($7.99/month, 10 credits/month), and Pro ($17.99/month, 1,000 credits/month), with 2 months free on annual billing.
💬 Our review
The short version: Autoplot is a reasonable pick for Mac-based researchers and students who are tired of the spreadsheet-to-script-to-export pipeline for every figure, and the low price ($7.99-17.99/month) makes it an easy tool to try against your actual workflow before committing.
Against using Python with Matplotlib directly, Autoplot trades some flexibility for a much lower barrier to entry — you get built-in plot types and analysis tools (power-law fits, CCDF, FSS) without writing plotting code yourself, though a Python/Matplotlib workflow remains more customizable for genuinely novel visualization needs. Against R, which has a mature ecosystem for statistical plotting, Autoplot's AI assistant that writes and runs Python for you based on a plain-language description is the more approachable option if you don't already know a scripting language well. Being local-first and Mac-only is a deliberate trade-off: it's a real plus for data privacy in sensitive research contexts, but it also means no Windows or Linux support and no cloud collaboration features that a browser-based tool might offer. <!-- ai-generated -->
💰 Pricing
📊 Global score
🤖 AI-enriched data
Gratuit (10 crédits IA/mois), Plus 7,99$/mois (10 crédits), Pro 17,99$/mois (1000 crédits). 2 mois offerts en annuel.
Pros
Unifie import, analyse et export de figures dans un seul workspace natif Mac
Outils d'analyse scientifique intégrés (fits loi de puissance, CCDF, FSS, matrices de corrélation)
Assistant IA qui écrit et exécute du Python à partir d'une description en langage naturel
Local-first et fonctionne hors-ligne, avantage confidentialité pour la recherche sensible
Cons
Mac uniquement — aucun support Windows ou Linux
Moins flexible qu'un script Python/Matplotlib pour des visualisations vraiment sur-mesure
Pas de collaboration cloud contrairement à un outil basé navigateur
Pas d'information sur l'ancienneté ou l'adoption réelle du produit