IcePanel
A shared, interactive map of how a company's software systems fit together — instead of a static architecture diagram that's out of date the moment someone draws it, teams can drill down from a big-picture view into individual services, link pieces direct
🔗 Visit IcePanel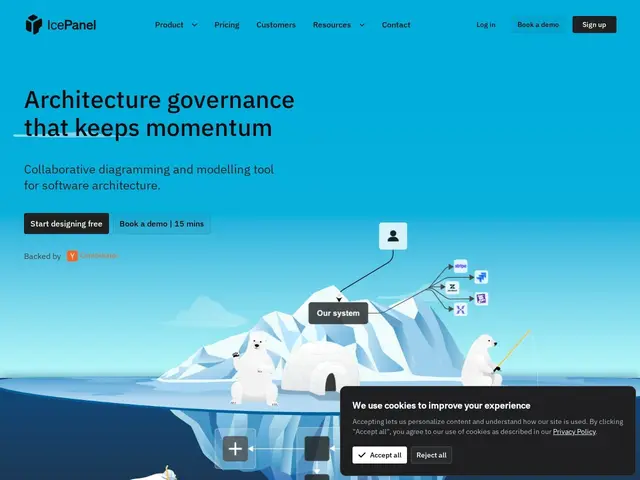
Description
As a company's software grows, explaining how all the pieces connect — which service talks to which database, what depends on what — becomes genuinely hard, and a static diagram drawn once in Visio or a whiteboard tool goes stale within weeks. IcePanel is built to be a living version of that map: a structured, drillable model of your systems that stays connected to how the architecture actually evolves.
IcePanel is a collaborative diagramming and modeling tool for software architecture built around the C4 model (Context, Containers, Components, Code), letting teams zoom from a company-wide system view down into individual services and their relationships. It supports forking a design to propose changes and merging them back in, similar to a code review workflow, tracks phased releases, and offers multiple audience-specific views so a diagram meant for engineers can differ from one meant for executives. Founded in 2021 in Vancouver, Canada and Y Combinator-backed, its customers include University of Cambridge, Cisco, BMW, Alphabet, and Statista.
💬 Our review
The short version: if your engineering org has outgrown static architecture diagrams that nobody trusts anymore, IcePanel's C4-based living model with a fork/merge workflow is a genuine step up — treating architecture documentation like code review rather than a one-off whiteboard session.
It competes against general diagramming tools like LucidChart, Miro, and draw.io, none of which are purpose-built for the C4 model or software architecture specifically — those are faster to start with for a one-off diagram but don't offer IcePanel's structured drill-down or fork/merge governance. It also overlaps with Structurizr, a more developer-centric, code-first C4 tool; IcePanel leans more visual and collaborative, Structurizr leans more toward diagrams-as-code. At $40-80/editor/month it's a real commitment for a mid-size team (and the Scale plan requires a 20-editor minimum), so it's best justified once architecture documentation has become an actual pain point, not from day one of a small team.
💰 Pricing
📊 Global score
🤖 AI-enriched data
Free : 1-5 éditeurs, 100 objets modèle max. Growth : $40/éditeur/mois (annuel). Scale : $80/éditeur/mois (min. 20 éditeurs). Enterprise : sur devis. Essai 14 jours sur Growth.
Pros
Modèle C4 avec navigation par niveaux de détail
Workflow fork/merge pour proposer des changements d'architecture
Vues multiples selon l'audience (ingénieurs vs direction)
Clients solides : Cambridge, Cisco, BMW, Alphabet
Cons
Prix élevé par éditeur ($40-80/mois) pour une équipe de taille moyenne
Plan Scale exige un minimum de 20 éditeurs
Moins immédiat qu'un outil de diagramming généraliste pour un usage ponctuel