R0Y
Lets you type a plain-English question like "how would my portfolio have done in the last recession" and get back a live, interactive financial dashboard — instead of building the chart yourself in a spreadsheet or a trading terminal.
🔗 Visit R0Y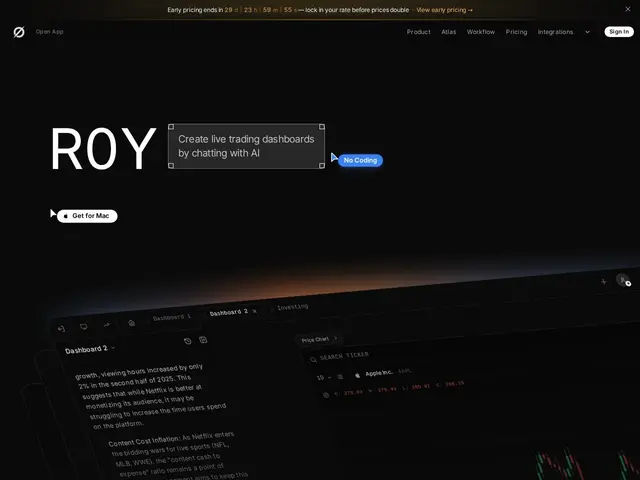
Description
Building a financial dashboard usually means wrestling with a spreadsheet, a clunky trading terminal, or a BI tool that wasn't designed for markets data. R0Y tries to skip that step entirely: you describe what you want to see — a projection, a backtest, a macro comparison — in plain language, and it assembles a live, interactive dashboard from its connected data sources.
R0Y is an AI-native investing studio marketed as a "natural language financial studio": it connects hundreds of millions of data points and generates structured financial analysis — projections, macro analysis, backtests, and strategy models — directly from a prompt, aimed at both individual investors and finance professionals who want institutional-grade dashboards without spreadsheet or terminal expertise. A stated transparency feature tracks the data sources, underlying code, and original prompt behind every dashboard section, so users can audit exactly how a number was derived rather than trusting a black box. The company is based in New York; pricing is not published on its (currently minimal) homepage.
💬 Our review
The short version: if you want to explore financial data or test an investing idea without spreadsheet or terminal fluency, R0Y's plain-language-to-dashboard pitch is compelling on paper — but with an unpublished pricing page and a bare-bones homepage, it reads as an early-stage product you should approach with appropriate caution before trusting it with real investing decisions.
R0Y sits in a growing wave of "prompt-to-dashboard" finance tools competing against both traditional players (Bloomberg Terminal, spreadsheets) and newer AI-native entrants like Rogo, which targets similar natural-language financial research for professional users. R0Y's differentiator is its audit-trail feature — showing the data source and formula behind every output — which matters a lot in finance, where an AI hallucinating a number is a real and costly risk, not just an annoyance. That said, the sparse public information (no visible pricing, limited independent reviews) means this is a tool to test cautiously on paper-trading or research use cases first, not to treat as a source of truth for real capital decisions until you've verified its output against known figures yourself.
📊 Global score
🤖 AI-enriched data
Aucune page tarifs visible sur le site au moment de l'évaluation
Pros
Génération de tableaux de bord financiers en langage naturel, sans compétence technique préalable
Traçabilité annoncée : source de données, code et prompt d'origine visibles par section
Accès à un large volume de données (centaines de millions de points annoncés)
Positionnement accessible face aux terminaux financiers professionnels coûteux
Cons
Tarification non publiée — impossible d'évaluer le rapport qualité/prix à l'avance
Site web très minimal au moment de l'évaluation, peu d'informations vérifiables
Produit jeune, peu de retours d'utilisateurs indépendants
Risque inhérent aux outils IA appliqués à la finance — à vérifier avant toute décision réelle