GreptimeDB
Open-source observability database unifying metrics, logs and traces: SQL and PromQL, written in Rust, object-storage native.
🔗 Visit GreptimeDB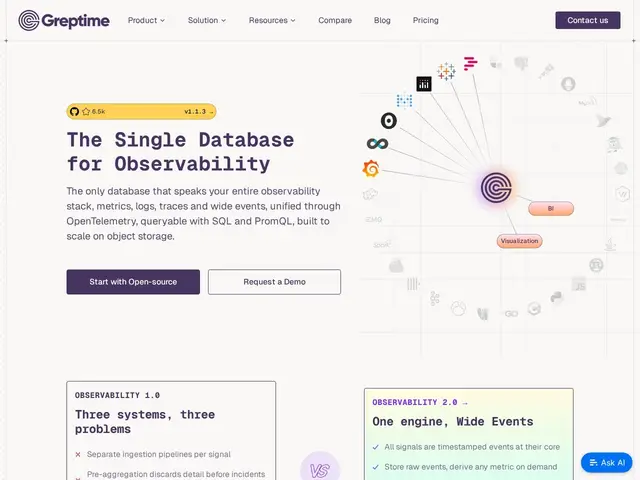
Description
To know whether their servers and apps are healthy, tech teams collect three kinds of signals: numbers (metrics), text records (logs) and request journeys (traces). Traditionally each kind needs its own storage system — three tools to install, learn and pay for. GreptimeDB is a single database that stores and searches all three, which means less to maintain and lower storage bills.
GreptimeDB is an open-source database purpose-built for observability data, consolidating metrics, logs, traces and events into one system instead of the traditional Prometheus + Loki + Elasticsearch stack. Everything is modeled as timestamped events in a columnar format, which enables cross-signal correlation — joining a latency spike to the logs and traces around it — with a single query. It speaks both SQL and PromQL, so existing Prometheus dashboards and alerts keep working, and ingests natively via OpenTelemetry across all signal types. The architecture is Rust on Apache Arrow and DataFusion, split into four independently scalable components (Frontend, Datanode, Metasrv, Flownode), with object storage — S3, GCS or Azure Blob — as primary storage. That makes compute stateless and long retention cheap. In-database preprocessing pipelines, streaming and materialized views handle transformation without an external ETL layer. The core reached v1.0 GA and is Apache 2.0 (6.5k GitHub stars); enterprise features and a managed cloud are licensed separately.
💬 Our review
The short version: one database instead of three for server-health data — the idea is right and the engineering is serious, but the ecosystem around it is still young.
GreptimeDB's premise is the correct diagnosis of a real disease: running Prometheus, Loki and Elasticsearch side by side means three query languages, three retention policies and three on-call runbooks for what is conceptually one dataset. Unifying signals in a columnar store with object storage as primary — so retention costs S3 prices, not SSD prices — is the architecture most observability vendors are converging on, and doing it in Rust with Arrow/DataFusion is credible engineering. The v1.0 GA milestone matters; this is no longer a science project. Now the honest caveats: at 6.5k stars the ecosystem is a fraction of ClickHouse's, which many teams already use for the same job with more tooling and hiring pool; VictoriaMetrics is more battle-tested for metrics-only workloads; and a four-component distributed system is real operational surface for a small team — start with the standalone mode. Grafana dashboards, exporters and muscle memory mostly transfer thanks to PromQL compatibility, which lowers the migration risk. Worth a pilot if your logs bill or Prometheus federation pain is growing; keep the boring stack if it still fits on one node.
💰 Pricing
📊 Global score
🤖 AI-enriched data
Apache 2.0 core free, self-hostable; enterprise and cloud priced separately
Pros
Metrics, logs and traces in one database
PromQL-compatible
Cheap retention on object storage
Cons
Young ecosystem
Distributed mode is real ops work